How To Calculate A Bell Curve
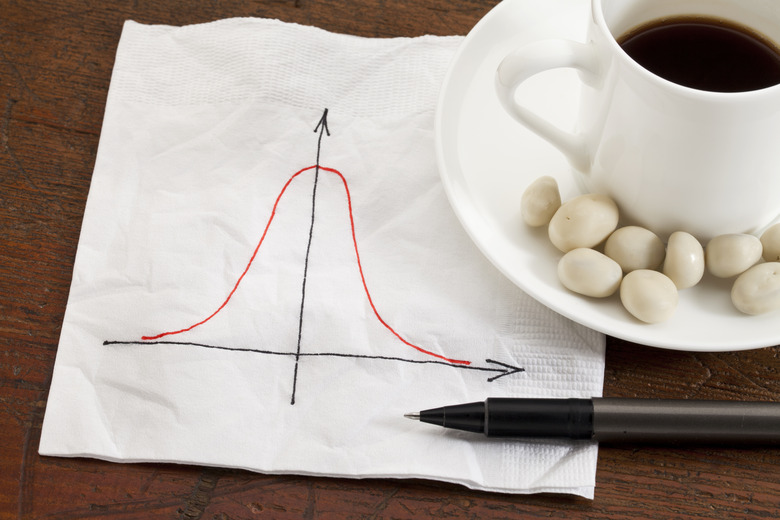
A bell curve gives a person studying a fact an example of a normal distribution of observations. The curve is also called the Gaussian curve after the German mathematician Carl Friedrich Gauss, who discovered many of the curve's properties. A graphed curve approximates the range and counts for many actual observations of facts that exist in nature and in civil society, such as weight and educational performance.
Step 1
Choose the fact you want a normal probability distribution for. Consider how the example of normal occurrences will help you come to a conclusion. Resolve the decisive questions about your fact. Is a normal weight distribution useful to studying the weights in a medical patient population? Or is the population too unusual or abnormal to use a normal curve?
Step 2
Make a data set for your the observations you plan to chart. For each subject, take down the fact as a numerical value. Assign each subject a number and label the observation \"x sub subject number.\" Arrange the \"x\" values from lowest to highest. Assign each subject a second number, the observation value order number, and label these observations \"x sub order number.\"
Step 3
Assign the number range for the numerical values, using the lowest observation to the highest observation.
Step 4
Use the bell curve formula to calculate the y axis value for each x axis value. The bell curve formula is y = (e^(?-x?^2/2) )/ ?2?. Y is the number of observations for an x value. The x is an observed value. Use the x sub order number for the calculation order and list order. Make a table of x values and the corresponding y values.
Step 5
Graph the bell curve for your fact. Using graph paper, arrange a graph with an x axis and a y axis. Draw the axis range to begin at your lowest value and end at your highest value. Begin the y axis at 0, for no observations, and end at the greatest number of potential observations for any x value. The greatest potential observations is the highest number you believe you could find for your fact; for example, the highest number of male patients with a weight of 180 pounds.
Step 6
When you want to compare your observed facts to a normal distribution, view a graph of your observations and the normal curve you graphed. Compare how the actual observations fall in the areas within one standard deviation of the mean. When you have a good data set for a normal population, 90 percent of your observations fall within 1.65 standard deviations, to the left and right of the normal curve mean. Differences form the normal curve tell you your population is above average, when the mean for the actual observations is to the right, or below average, when your observed mean is to the left.
Things Needed
- Pencil
- Paper
- Calculator
- Graph paper or spread sheet with graph function
TL;DR (Too Long; Didn't Read)
For facts that have normal distributions in the population, the higher your number of observations–assuming you have a random sample–the closer the observed curve will be to the bell curve.
Warning
Note that your bell curve does not have the two long tails, to the left and to the right, that the theoretical bell curve has. You curve has limits at the lowest and highest observed x values.
Cite This Article
MLA
, Adam Benjamin. "How To Calculate A Bell Curve" sciencing.com, https://www.sciencing.com/calculate-bell-curve-5760681/. 18 December 2009.
APA
, Adam Benjamin. (2009, December 18). How To Calculate A Bell Curve. sciencing.com. Retrieved from https://www.sciencing.com/calculate-bell-curve-5760681/
Chicago
, Adam Benjamin. How To Calculate A Bell Curve last modified March 24, 2022. https://www.sciencing.com/calculate-bell-curve-5760681/