Constructing a weather station model can be a satisfying experience, similar to learning a secret language. Weather enthusiasts see these station models on both surface- and upper-level weather maps. Serving the purpose of accommodating space for all pertinent information from a multitude of weather stations onto a map, the station model is an essential tool. Familiarity with these weather maps and a cursory knowledge of weather will have you reading and assembling weather station models in no time.
- Drawing tool
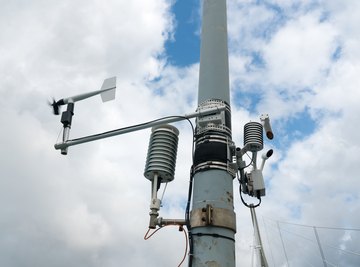
- Access to weather data
- Weather station model current weather symbol guide
The National Weather Service uses 7 miles as the maximum visibility. Have reference points at your weather station to assist with visibility.
Note that the average sea level pressure is between about 930 and 1050 millibars; thus, a recording of 298 is assumed to be 1029.8, as opposed to 929.8, unless there is an abnormal event such as a hurricane near the weather station.

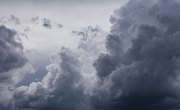
Draw a circle. Look at the sky and divide it into eighths. Fill in the circle based on how many eighths of the sky are covered with clouds. A clear circle represents a station with no clouds observed; a full circle is an overcast sky over the weather station.

Connect a line to the circle extending toward the direction the wind is coming from. Draw a long line connecting and perpendicular to the tip of the first line to represent a 10-knot wind speed. Draw a shorter line for 5 knots and a flag for 50 knots.
Determine the temperature and dew point of your weather station. Record the temperature in degrees Fahrenheit just to the left of the wind barbs. Record the dew point under the temperature, just beneath the circle and to its right.

Plot the symbol for current weather just to the left of the station model circle. Place the visibility in miles to the left of the current weather symbol.
Record sea level pressure to the nearest tenth of a millibar in the upper right of the station model circle. Place only the last three digits of this number on your weather station model.

Place the pressure change to the nearest tenth just below your current sea level pressure record. Signify a pressure increase with a plus sign and a decrease with a negative sign.
Things You'll Need
Tips
Warnings
Resources
Tips
- The National Weather Service uses 7 miles as the maximum visibility.
- Have reference points at your weather station to assist with visibility.
About the Author
Writing professionally since 2008, Don Shepard has been published in a water resources laboratory manual and in various online publications. He holds a Bachelor of Science in meteorology from Ball State University. His most recent work includes performing editing team leading duties for a prominent political advocacy firm.