How To Solve Math Problems Using A Flowchart
Getting to the one correct answer to a math problem challenges many students who may not know where to start or how to get to the answer. Flowcharts provide a framework for the math process, giving students a step-by-step approach to tackling the problem. Teach students how to read flowcharts so you can integrate them into the math curriculum for improved problem solving.
Flowchart Basics
Flowchart Basics
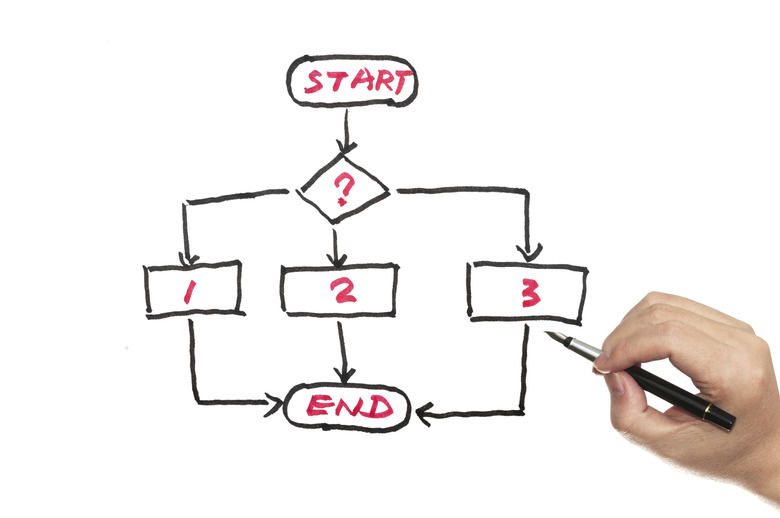
The shapes containing data on a flowchart represent different types of information. The beginning and ending points go in ovals. Rectangles contain processes or actions to take, such as operations or calculations. Diamonds represent decisions — often with a yes or no answer — that change the direction in which you move through the flowchart. An example would be to decide if a fraction is in lowest terms. Arrows connect the shapes to help students move through the steps in the correct order. Practice using flowcharts with a process the kids know, such as a routine you use in the classroom. Put each step into the flowchart and have the kids move through it to practice going in order.
Math Problem Components
Math Problem Components
Each small step in the math problem needs its own spot on the flow chart. A flowchart for adding fractions would include steps for finding common denominators, adding numerators and reducing the fraction to its lowest terms. In this example, you have the "start" in an oval leading to a diamond to represent the question of whether or not the fractions have common denominators. If yes, students move to a rectangle that tells them to add the numerators. If no, the students follow an arrow to a rectangle telling them to find a common denominator. Students then move to a rectangle telling them to add numerators, followed by a decision diamond to determine if the fraction is in lowest terms. If it is, the process ends. If not, students would follow an arrow to a rectangle telling them to reduce the fraction to its lowest terms.
Introductory Math Flowcharts
Introductory Math Flowcharts
When introducing flowcharts for solving math problems, provide the flowchart steps for students. Break down the process for your class so students understand how the flowchart works as it relates to math. Start with a simple problem to allow practice working through the flowchart. You might do practice problems as a class. Talk through the process so students understand what you are doing. Give the students practice problems using flowcharts with the steps already filled in.
Advanced Flowcharts
Advanced Flowcharts
Once the students understand how to use flowcharts to solve problems, put them in charge. Have the students draw a flowchart based on a problem they need to solve. This requires students to read through the problem and first identify the specific steps that need to happen to solve the problem. They must also determine if there are any places that require a decision, which would go in a diamond shape. Once they draw the flowcharts, have them actually solve the problems using the flowcharts.
Cite This Article
MLA
Frost, Shelley. "How To Solve Math Problems Using A Flowchart" sciencing.com, https://www.sciencing.com/solve-math-problems-using-flowchart-7840920/. 24 April 2017.
APA
Frost, Shelley. (2017, April 24). How To Solve Math Problems Using A Flowchart. sciencing.com. Retrieved from https://www.sciencing.com/solve-math-problems-using-flowchart-7840920/
Chicago
Frost, Shelley. How To Solve Math Problems Using A Flowchart last modified August 30, 2022. https://www.sciencing.com/solve-math-problems-using-flowchart-7840920/