How To Calculate Audpc
The Area Under the Disease Progress Curve (AUDPC) is a quantitative measure of disease intensity with time. It is used in plant pathology to indicate and compare levels of resistance to diseases among varieties of plants. The trapezoid method.is the most common way to calculate AUDPC. It is performed by using a formula devised by Campbell and Madden in 1990 or by plotting a graph of percentage of infection against time and summing the trapezoids between time intervals.
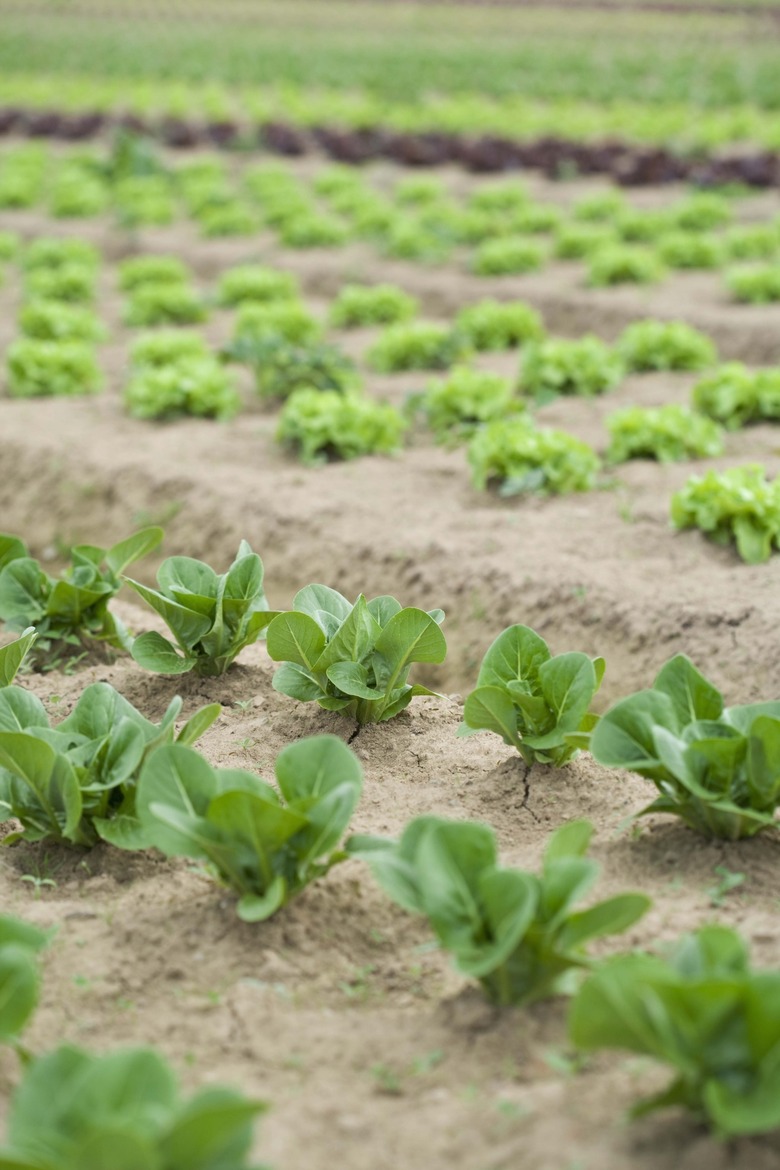
Measure Disease Progression
Step 1
Research rules and guidelines that apply to measuring the specific disease and crop you investigate. The required size of the plant sample varies by crop and disease. Studying late blight in tubers, for example, requires a minimum sample of 40 plants.
Step 2
Plant the appropriate number of plants required for the study.
Step 3
Watch carefully for signs of the disease. Research when signs are expected to occur so that you are prepared. For example, signs of late blight occur about 30 to 40 days after planting and 10 days after the last application of fungicide.
Step 4
Estimate visually the percentage of infected leaf area in your sample as soon as you notice the disease.
Step 5
Record the percentage of infected leaf area at regular time intervals. Researchers take reading for late blight every seven days if the disease progresses more quickly than expected. Readings are taken every 14 days when disease progression is slower.
Step 6
Stop recording infection measurements when the percentage of infection stops increasing, and the disease progression levels.
Calculate AUDPC from an Equation
Step 1
Add the first two infection percentages you recorded.
Step 2
Divide the addition result by two to find the average or mid-value of the two readings.
Step 3
Multiply the average or mid-value by the time interval, which is the number of days from the first reading to the second reading. If you took the first reading on day 20 and the second reading on day 27, for example, then the number of days, or time interval, is seven days.
Step 4
Record the result in units of percentage days. The value is an area of a trapezoid.
Step 5
Repeat Steps One through Four for the second and third infection readings you took. Their result will be the area of a second trapezoid. Repeat Steps One through Four until you calculated trapezoid areas for all readings.
Step 6
Add all of the trapezoids to find the AUDPC. Lower AUDPCs represent slower disease progression and greater resistance to the disease. Higher AUDPCs represent faster disease progression and higher susceptibility to the disease.
TL;DR (Too Long; Didn't Read)
AUDPC also is found by plotting the percentage of infection against time on a graph. The area of each trapezoid between the readings is calculated using simple geometry.
AUDPC allows for time intervals between readings to vary, but readings should start soon after the disease begins. A long delay results in susceptible materials not forming part of the disease progress curve.
Warning
Due to the estimation involved in assessing the percentage of infection, AUDPC is considered a pseudo-quantitative variable. The AUDPC is only an estimate of the area under the actual infection curve.
The AUDPC is not generally comparable across experiments due to various factors such as the presence of adverse or favorable disease conditions.
Cite This Article
MLA
Jackson, Clare. "How To Calculate Audpc" sciencing.com, https://www.sciencing.com/calculate-audpc-12033613/. 24 April 2017.
APA
Jackson, Clare. (2017, April 24). How To Calculate Audpc. sciencing.com. Retrieved from https://www.sciencing.com/calculate-audpc-12033613/
Chicago
Jackson, Clare. How To Calculate Audpc last modified March 24, 2022. https://www.sciencing.com/calculate-audpc-12033613/