How To Apply The Central Limit Theorem
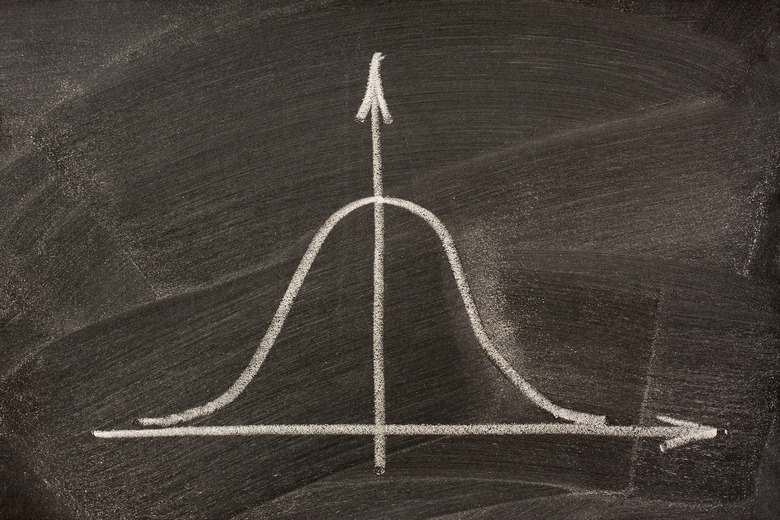
In statistics, random sampling of data from a population often leads to the production of a bell-shaped curve with the mean centered on the peak of the bell. This is known as a normal distribution. The central limit theorem states that as the number of samples increases, the measured mean tends to be normally distributed about the population mean and the standard deviation becomes narrower. The central limit theorem can be used to estimate the probability of finding a particular value within a population.
Step 1
Collect samples and then determine the mean. For example, assume you want to calculate the probability that a male in the United States has a cholesterol level of 230 milligram per deciliter or above. We would start by collecting samples from 25 individuals and measuring their cholesterol levels. After collecting the data, calculate the mean of the sample. The mean is obtained by summing each measured value and dividing by the total number of samples. In this example, assume that the mean is 211 milligrams per deciliter.
Step 2
Calculate the standard deviation, which is a measure of the data "spread". This can be done in a few easy steps:
1. Subtract each data point from the mean. 2. Square the result, and sum this value for each point. 3. Divide by the total sample number. 4. Take the square root.
In this example, assume that the standard deviation is 46 milligrams per deciliter.
Step 3
Calculate the standard error by dividing the standard deviation by the square root of total sample number:
Standard error = 46 / sqrt25 = 9.2
Step 4
Draw a sketch of the normal distribution and shade in the appropriate probability. Following the example, you want to know the probability that a male has a cholesterol level of 230 milligram per deciliter or above. To find the probability, find out how many standard errors away from the mean 230 milligram per deciliter is (Z-value):
Z = 230 – 211 / 9.2 = 2.07
Look up the probability of obtaining a value 2.07 standard errors above the mean. If you need to find the probability of finding a value within 2.07 standard deviations of the mean, then z is positive. If you need to find the probability of finding a value beyond 2.07 standard deviations of the mean then z is negative.
Step 5
Look up the z-value on a standard normal probability table. The first column on the left-hand side shows the whole number and first decimal place of the z-value. The row along the top shows the third decimal place of the z-value. Following the example, since our z-value is -2.07, first locate -2.0 in the left-hand column, then scan the top row for the 0.07 entry. The point at which these column and rows intersect is the probability. In this case, the value read off the table is 0.0192 and thus the probability of finding a male that has a cholesterol level of 230 milligram per deciliter or above is 1.92 percent.
Things Needed
- Pen
- Paper
Cite This Article
MLA
Markings, Samuel. "How To Apply The Central Limit Theorem" sciencing.com, https://www.sciencing.com/calculate-central-limit-theorem-5974471/. 24 April 2017.
APA
Markings, Samuel. (2017, April 24). How To Apply The Central Limit Theorem. sciencing.com. Retrieved from https://www.sciencing.com/calculate-central-limit-theorem-5974471/
Chicago
Markings, Samuel. How To Apply The Central Limit Theorem last modified March 24, 2022. https://www.sciencing.com/calculate-central-limit-theorem-5974471/
