How To Calculate Kcat
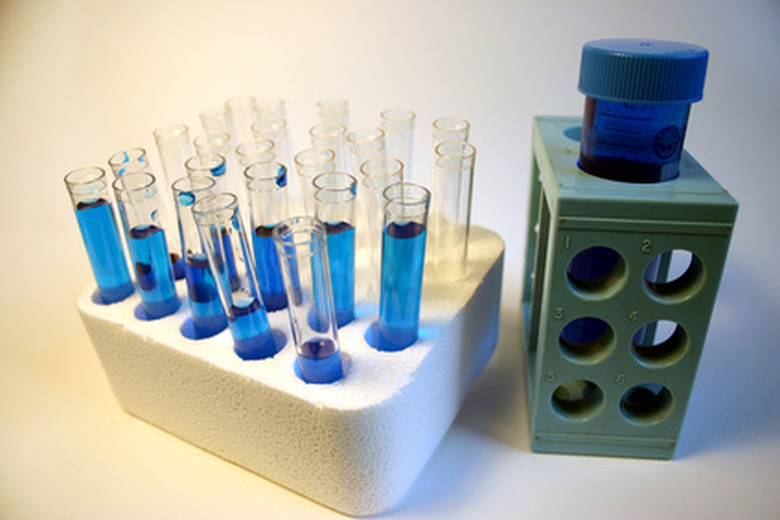
In chemical reactions catalyzed by an enzyme, the enzyme lowers the amount of activation energy required by temporarily bonding with the substrate and twisting it into a strained state. The k(catalyst) or "kcat" for the reaction refers to the concentration-independent constant for the rate at which a particular enzyme can metabolize a substrate into a product molecule. To calculate kcat, scientists first mix several test tubes with varying concentrations of substrate (known as an "enzymatic assay") and test them at constant time intervals with a light spectrophotometer to measure the growing concentrations of product molecules. This data is then plotted onto a graph and analyzed.
Calculating Initial Velocities
Step 1
Plot a chart of product concentration versus time for the data from the enzymatic assay's first test tube. Note: the horizontal axis should be "time," and the vertical axis should be "product concentration."
Step 2
Calculate the linear regression line for the data points you plotted in Section 1, Step 1. While Excel and graphing calculators can easily determine this linear model, you can derive an estimate of the regression line's slope by dividing the difference in product concentration between adjacent data points by their difference in time.
Step 3
Record the slope of the linear regression line from Section 1, Step 2 as "initial reaction velocity (Vo)." Note: in the regression line model "[product concentration] = m [time] + b," the coefficient "m" is the slope.
Step 4
Repeat Steps 1, 2 and 3 for the rest of the test tubes in the assay.
Calculating Vmax
Step 1
Plot the inverse of substrate concentration for each test tube versus the inverse of its initial reaction velocity (from Section 1, Step 4). For example, if the initial velocity for a test tube with an initial substrate concentration of 50 micromolar (uM) was 80 uM/s, the inverses would be 1/50 uM for the substrate concentration and 1/80 uM/s for the initial velocity. Note: the inverse substrate concentration should be on the horizontal axis, and the inverse initial velocity should be on the vertical axis.
Note: substrate concentration should be on the horizontal axis, and initial reaction velocity should be on the vertical axis.
Step 2
Determine the linear regression line for the chart you plotted in Section 2, Step 1. Note: because you will need to know the y-intersect for the regression line, you should enter the points from Section 2, Step 1 into either Excel or a graphing calculator and use the built-in regression modeling functionality.
Step 3
Divide 1 by the y-intersect from the linear regression line. This will give you the value of the inverse of Vmax, the maximum reaction velocity for the enzyme. Note: if the linear regression model takes the form "[Inverse Vo] = m [Inverse Substrate Conc.] + b," then the value of "b" would be the y-intersect. Divide 1 by "b" to calculate the inverse of Vmax.
Step 4
Divide 1 by the result from Section 2, Step 3 to calculate the actual value of Vmax.
Step 5
Determine the concentration of the enzyme in the original assay (see the raw data). Note: the enzyme concentration is the same for all of the test tubes; only the substrate concentrations vary in the assay.
Step 6
Divide the Vmax (from Section 2, Step 4) by the enzyme concentration (from Section 2, Step 5). The result is the value of Kcat.
Cite This Article
MLA
Pasquesi, Andy. "How To Calculate Kcat" sciencing.com, https://www.sciencing.com/calculate-kcat-6080754/. 24 April 2017.
APA
Pasquesi, Andy. (2017, April 24). How To Calculate Kcat. sciencing.com. Retrieved from https://www.sciencing.com/calculate-kcat-6080754/
Chicago
Pasquesi, Andy. How To Calculate Kcat last modified August 30, 2022. https://www.sciencing.com/calculate-kcat-6080754/
