How To Convert Z-Score To Percentages
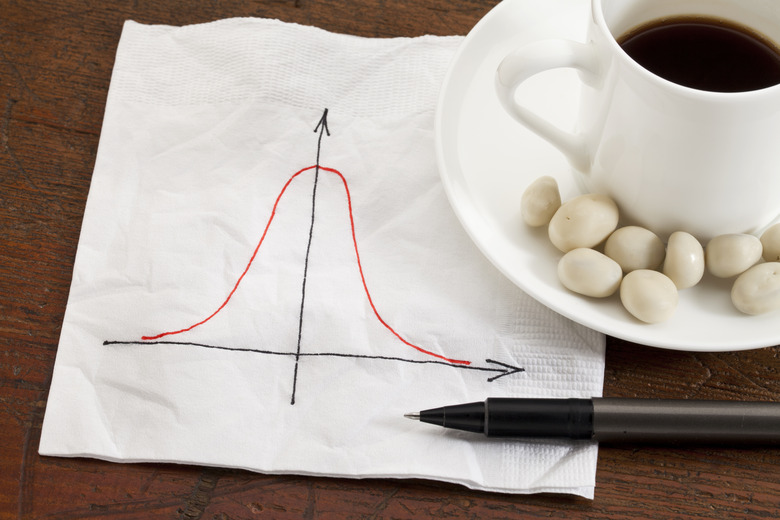
Statisticians use the term "normal" to describe a set of numbers whose frequency distribution is bell shaped and symmetrical on either side of its mean value. They also use a value known as standard deviation to measure the spread of the set. You can take any number from such a data set and perform a mathematical operation to change it into a Z-score, which shows how far that value is from the mean in multiples of the standard deviation. Assuming you already know your Z-score, you can use it to find the percentage of values in your collection of numbers which are within a given region.
Step 1
Discuss your particular statistical requirements with a teacher or work colleague, and determine if you want to know the percentage of numbers in your data set which are either above or below the value associated with your Z-score. As an example, if you have a collection of student SAT scores which have a perfect normal distribution, you may wish to know what percentage of students scored above 2,000, which you calculated as having a corresponding Z-score of 2.85.
Step 2
Open a statistical reference book to the z table and scan the leftmost column of the table until you see the first two digits of your Z-score. This will line you up with the row in the table you require to find your percentage. For instance, for your SAT Z-score of 2.85, you would find the digits "2.8" along the leftmost column and see that this lines up with the 29th row.
Step 3
Find the third and final digit of your z-score in the uppermost row of the table. This will line you up with the proper column within the table. In the case of the SAT example, the Z-score has a third digit of "0.05," so you would find this value along the top row and see that it aligns with the sixth column.
Step 4
Look for the intersection within the main portion of the table where the row and column you have just identified meet up. This is where you will find the percentage value associated with your Z-score. In the SAT example, you would find the intersection of the 29th row and the sixth column and find the value there is 0.4978.
Step 5
Subtract the value you just found from 0.5, if you wish to calculate the percentage of data in your set which is greater than the value you used to derive your Z-score. The calculation in the case of the SAT example would therefore be 0.5 – 0.4978 = 0.0022.
Step 6
Multiply the outcome of your last calculation by 100 to make it a percentage. The result is the percentage of values in your set which are above the value which you converted into your Z-score. In the case of the example, you would multiply 0.0022 by 100 and conclude that 0.22 percent of the students had an SAT score above 2,000.
Step 7
Subtract the value you just derived from 100 to calculate the percentage of values in your data set which are below the value you converted to a Z-score. In the example, you would calculate 100 minus 0.22 and conclude that 99.78 percent of students scored below 2,000.
TL;DR (Too Long; Didn't Read)
In cases where samples sizes are small, you may see a t-score rather than a Z-score. You require a t-table to interpret this score.
Cite This Article
MLA
Judge, Michael. "How To Convert Z-Score To Percentages" sciencing.com, https://www.sciencing.com/convert-zscore-percentages-8776927/. 13 March 2018.
APA
Judge, Michael. (2018, March 13). How To Convert Z-Score To Percentages. sciencing.com. Retrieved from https://www.sciencing.com/convert-zscore-percentages-8776927/
Chicago
Judge, Michael. How To Convert Z-Score To Percentages last modified August 30, 2022. https://www.sciencing.com/convert-zscore-percentages-8776927/
