How To Create Pictures With Math Functions
Pictures of mathematical functions are referred to as graphs. You can construct two-dimensional graphs with an x and y axis or three-dimensional graphs with an x, y and z axis. Assuming a two-dimensional graph, the math equation will give the value of y as a function of x or y = f(x). This says that as x changes, y will change according to the function f(x). For example, y = 2x is a simple function where if x = 2, y = 4 and if x = 6, y = 12. You can plot this relationship between x and y on a graph to create a visual representation of the relationship between x and y.
Create a Graph of the Equation: y = 2x,

Step 1
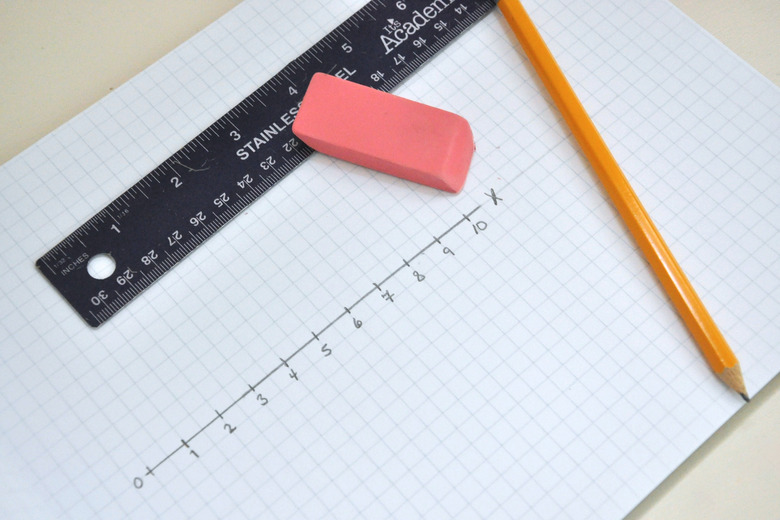
Draw a straight horizontal line on a piece of paper. Label the line "x." Divide the line into 10, equally-spaced sections, with each section denoted by small, vertical hash marks. Label the hash marks from 1 to 10.
Step 2

Draw a straight vertical line, starting at the point where you started the horizontal line for x. Label this line "y." Divide the line into 20, equally-spaced sections, with each section denoted by small, horizontal hash marks. Label the hash marks from 1 to 20.
Step 3
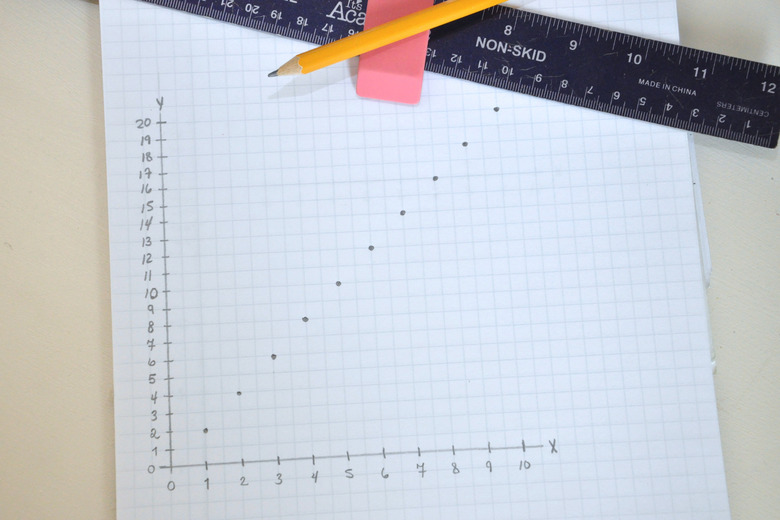
Plot y = 2x. Start with x = 1. At x = 1, y = 2. On the graph, go to the hash mark on the x-axis labeled 1. While at 1 on the x-axis, go up vertically to the 2 hash mark on the y-axis and place a "dot" at that point. Move to x = 2. At x=2, y = 4. On the graph, go to the hash mark on the x-axis labeled 2. While at 2 on the x-axis, go up vertically to the 4 hash mark on the y-axis and place a "dot" at that point. Repeat this process all the way to x = 10.
Step 4

Draw a line connecting all the dots. You will have a straight line pointed upward. That straight line is a graphical or visual representation of the equation y = 2x.
Create a Graph of the Equation: y = sin (x),
Step 1
Draw a straight, horizontal line on a piece of paper. Label the line "x." Divide the line into 10 equally-spaced sections, with each section denoted by small, vertical hash marks. Label the hash marks from 0 to 10.
Step 2

Draw a straight vertical line. Draw the line so that the beginning of the horizontal line for x is in the middle of the vertical line. This way, you will have one half of the vertical line below the x line — which is the negative direction — and the other half above the x line — which is the positive direction. Divide the line into 10 equally-spaced sections, with each section denoted by small, horizontal hash marks. You will have five hash marks in the negative direction and five in the positive direction. Label the hash marks in the negative direction 0 to -5 and the hash marks in the positive direction 0 to 5. Also place four, equally-spaced hash marks between 0 and 1 in both the positive and negative direction. Label them 0.2, 0.4, 0.6 and 0.8 in both the positive and negative direction.
Step 3
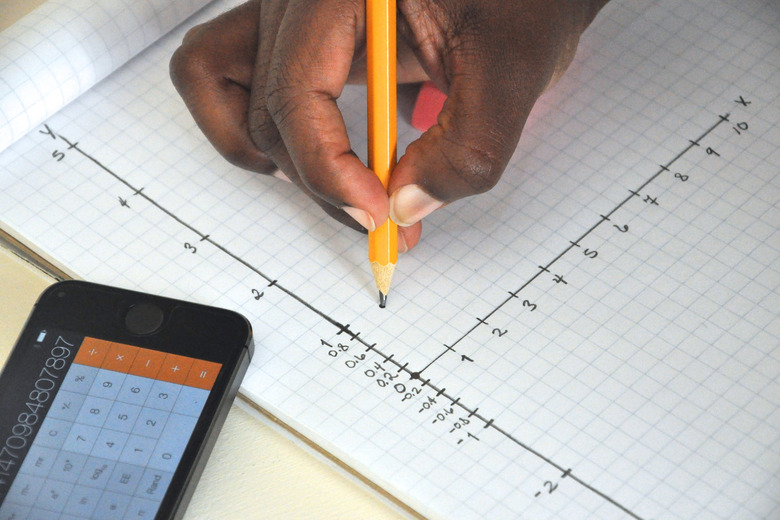
Plot the function y = sin (x). Using a calculator with a sine function, start with x = 0. At x = 0, the sine of 0 is 0, so y = 0. On the graph, place a dot at x = 0. At x = 1, the sine of 1 is 0.84, so y = 0.84. Go to the x-axis where x = 1 and trace up to the y-axis at y = 0.84 and place a dot at that point. Repeat this for x = 2 through 10.
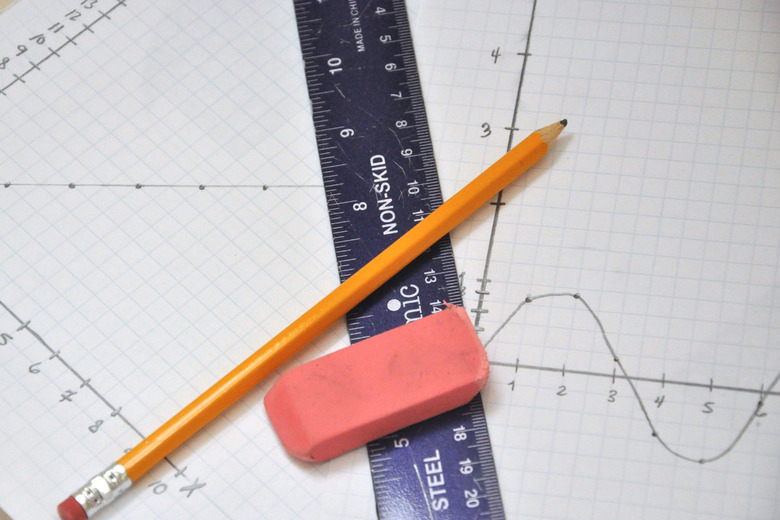
Step 4
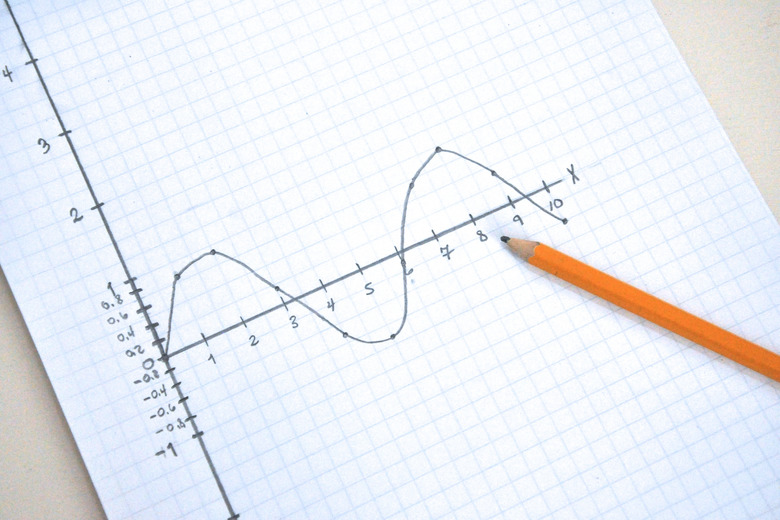
Draw a line connecting all the dots. You will have sine wave that oscillates back and forth between the positive and negative axis. This is the graphical or visual representation of the equation y = sin (x).
References
Cite This Article
MLA
Chestnut, Dwight. "How To Create Pictures With Math Functions" sciencing.com, https://www.sciencing.com/create-pictures-math-functions-8210378/. 24 April 2017.
APA
Chestnut, Dwight. (2017, April 24). How To Create Pictures With Math Functions. sciencing.com. Retrieved from https://www.sciencing.com/create-pictures-math-functions-8210378/
Chicago
Chestnut, Dwight. How To Create Pictures With Math Functions last modified August 30, 2022. https://www.sciencing.com/create-pictures-math-functions-8210378/