How To Explain Topography
At first glance, a topographic map might look a bit confusing with its various lines, markings and colors. Each marking and color represents something different! However, understanding and describing the topography of an area can prove indispensable for a number of different professions and helps people better understand the world around them.
Description of Topography
Description of Topography
Topography is the description of the landforms in a given area. Some examples include rivers, mountains and even manmade structures. The term 'topography' comes from the Latin words topo, which stands for place or location, and graphia, which stands for drawing or writing. This essentially translates to drawing or describing a location.
Topographic Maps
Topographic Maps
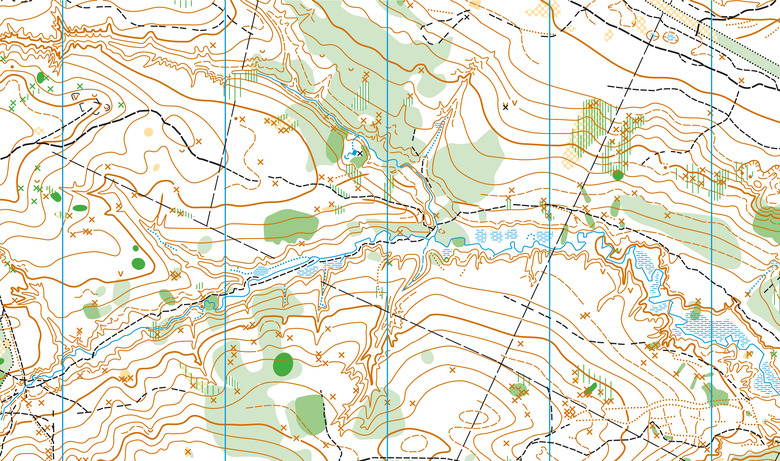
The most effective way to communicate the topography of an area is by creating or using a topographic map. Topographic maps contain representations of different topographic features and provide key details for those features, such as elevation level.
People generally create topographic maps using one of two methods; direct surveys or indirect surveys. In a direct survey, the surveyor physically visits a location to take measurements using precise equipment such as clinometers. They use this information on elevation and distance to create topographic maps.
In indirect surveys, the surveyor creates a topographic map using indirect methods such as satellite images or even sonar for underwater regions. Surveyors typically use indirect surveys when mapping areas that aren't easily accessible, such as remote regions or the ocean floor.
Types of Topographic Features
Types of Topographic Features
When you look at a topographic map, you will typically spot four different types of topographic features represented – landforms, watercourses, vegetation and manmade features. These each have different symbols and/or colors to depict specific information.
Landforms on topographic maps depict land-based structures such as hills, mountains, valleys, ridges and more. The most important information conveyed about landforms is the elevation and relief. The elevation represents the landform's height or distance from sea level. The relief shows the landform's relative shape. In topography, landforms are generally represented by a series of lines.
Watercourses on topographic maps depict aquatic features such as streams, lakes, rivers, oceans and more. These are generally represented using blue coloration. On topographic maps, watercourses typically feature depth and any underwater hazards such as reefs or shipwrecks.
Vegetation on topographic maps uses colors or patterns to depict different types of plant life such as mangroves, orchards, woodlands and national parks. Different colorations and patterns can represent different types of forests, or forests with differing tree densities.
Manmade features are the final type of topographic notation. These can identify the presence of physical structures or invisible boundaries. Some physical structures represented include roads, highways, train tracks and walking paths. Some invisible boundaries notated by topographic maps include state lines, county lines and boundaries for national parks.
What Is Topography Used For?
What Is Topography Used For?
Topography and topographic maps have an immense variety of uses. They can vary in their complexity, from simply showing coloration differences or noting the presence of forest or water, to listing numerous symbols representing everything from major roads to power lines. The use of the topographic map dictates the detail level.
Topographic information is incredibly important during the process of building and construction. Understanding the elevation of the land and any geological features present can help builders understand how much preparation a site needs before they can construct a building.
Understanding the topography of a region can also aid in weather forecasting as well. Water depths and the presence of mountains, lakes, valleys and other features impact how weather forms and how a storm behaves. For example, hurricanes moving over warm, shallow waters typically increase in strength.
Cite This Article
MLA
Zinni, Yasmin. "How To Explain Topography" sciencing.com, https://www.sciencing.com/explain-topography-7549665/. 20 October 2021.
APA
Zinni, Yasmin. (2021, October 20). How To Explain Topography. sciencing.com. Retrieved from https://www.sciencing.com/explain-topography-7549665/
Chicago
Zinni, Yasmin. How To Explain Topography last modified March 24, 2022. https://www.sciencing.com/explain-topography-7549665/