How To Graph Exponential Functions, An Easy Way
The Graphs of Exponential functions can be easily sketched by using three points on the X-Axis and three points on the Y-Axis. The points on the X-Axis are, X=-1, X=0, and X=1. To determine the points on the Y-Axis, we use the Exponent of the base of the Exponential function. If the Base of the Exponential is the number 'b', where b > 0 and b ≠ 1, then the points on the Y-Axis, that corresponds respectively with the points on the X-Axis, are; y=b^x,where, x=-1, and x=0, and x=1.The coordinates of the points that the graph would pass through are(-1,1/b),(0,1) and (1,b). When working with these points, the graphs can be easily sketched.
Step 1
The Graphs of Exponential functions can be easily sketched by using three points on the X-Axis and three points on the Y-Axis. The three points on the X-axis are; X=-1, X=0, and X=1.
Step 2
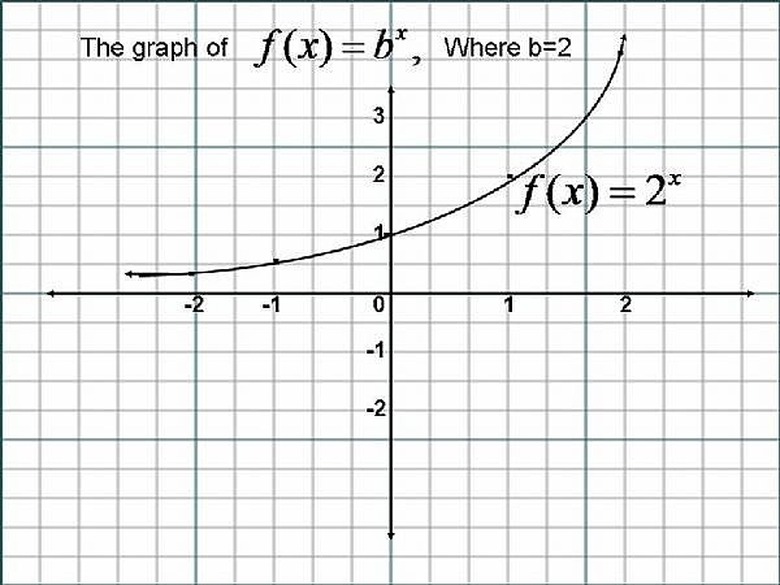
To determine the points on the Y-Axis, we use the Exponent of the base of the exponential function. For example, let us graph the function f(x)= 2^x, where the base of this function is 2 and the Exponent is 'x'.
Step 3
When the Exponent of the base is equal to -1, then Y=1/2, since 2^(-1) = 1/2. When the Exponent of the base is 0, any b to the Exponent 0, is equal to 1, then Y=1, since 2^0 = 1 . If the Exponent of the base is 1, then y=2, since 2^1 = 2. The coordinates of the points that this graph would pass through are (-1,1/2),(0,1) and (1,2). Please click on the image to get a better understanding.
Things Needed
- Paper and
- Pencil
- Graph Paper
Cite This Article
MLA
Contributor, . "How To Graph Exponential Functions, An Easy Way" sciencing.com, https://www.sciencing.com/graph-exponential-functions-easy-way-4592663/. 24 April 2017.
APA
Contributor, . (2017, April 24). How To Graph Exponential Functions, An Easy Way. sciencing.com. Retrieved from https://www.sciencing.com/graph-exponential-functions-easy-way-4592663/
Chicago
Contributor, . How To Graph Exponential Functions, An Easy Way last modified March 24, 2022. https://www.sciencing.com/graph-exponential-functions-easy-way-4592663/
