How To Create A Log Graph
A log graph, formally known as a semi-logarithmic graph, is a graph that uses a linear scale on one axis and a logarithmic scale on the other axis. It's useful in science for plotting data points of two variables where one of the variables has a much larger range of values than the other variable. By plotting the data in this way, we can frequently observe relationships in the data that would not be as obvious if both variables were plotted linearly.
Step 1
Define a logarithm. For the equation x = b^y, we would say that y is the logarithm of x to the base b. Therefore if x = b^y, then y = logb(x).
Step 2
Establish linear and logarithmic scales. The markings on a linear scale show individual units and are labeled 1, 2, 3, 4 and so on. The markings on a logarithmic scale show powers of the logarithm's base. For example, a logarithmic scale with a base of 10 would be labeled 10, 100, 1,000 and so on.
Step 3
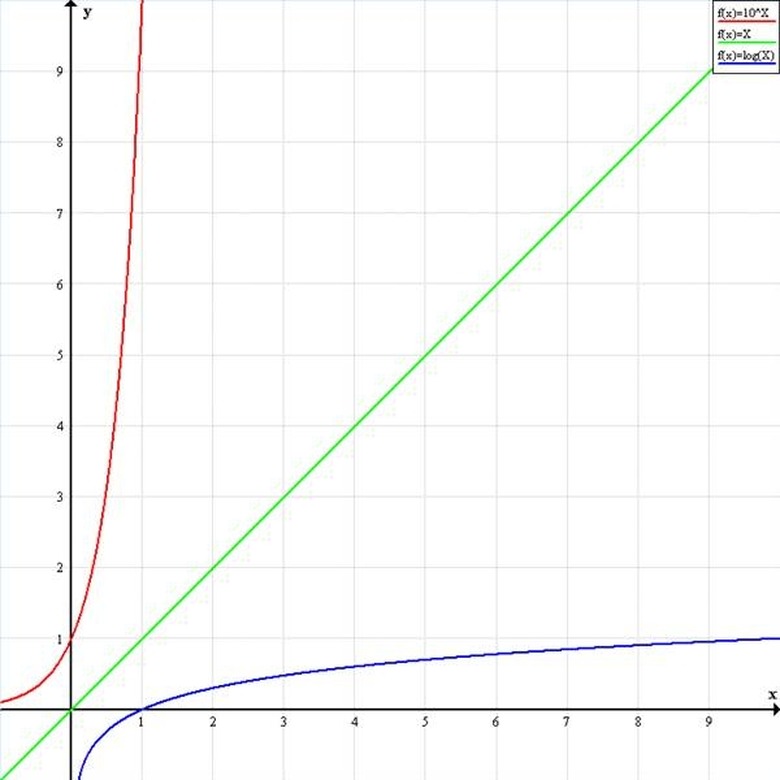
Map functions on a linear graph. Both the x and y scales measure the same units. In the illustration, y = f(x) in green is therefore a straight line with a slope of 1. Y = log10(x) in blue intersects the x axis at x = 1 and has a positive slope that approaches 0. y = 10^x in red intersects the y axis at y = 1 and has a positive slope that approaches infinity.
Step 4
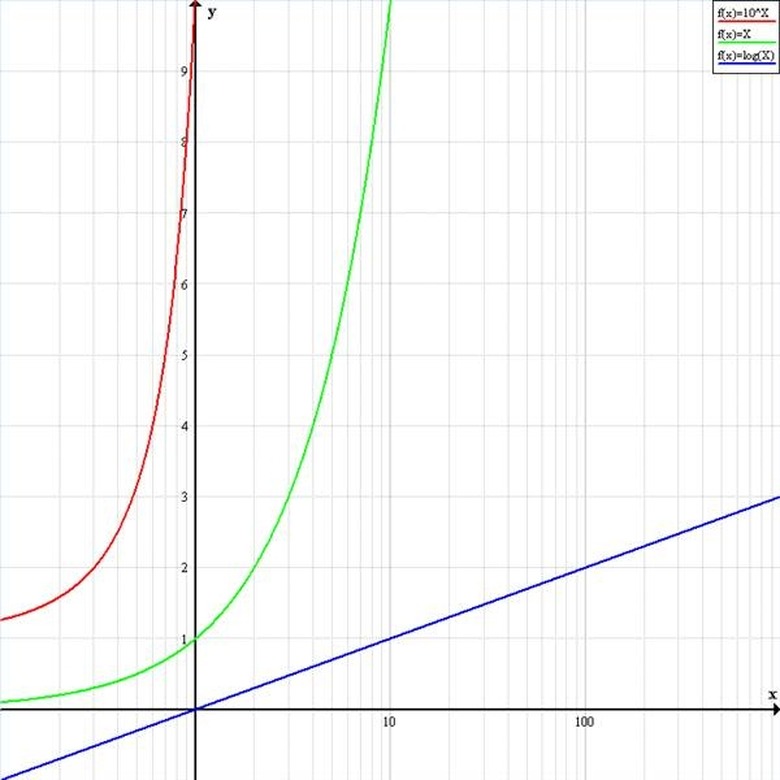
Use a lin-log graph. This type of log graph has a y axis with a linear scale and an x axis with logarithmic scale. The scale of the x axis is therefore compressed by a factor of 10^x in relation to the y axis. In the illustration, y = log10(x) in blue now resembles the line y = x on the linear graph. Y = 10^x in red intersects the y axis at x = 10 and has a positive slope that approaches infinity. Y = x in green now looks like y = 10^x on the linear graph.
Step 5
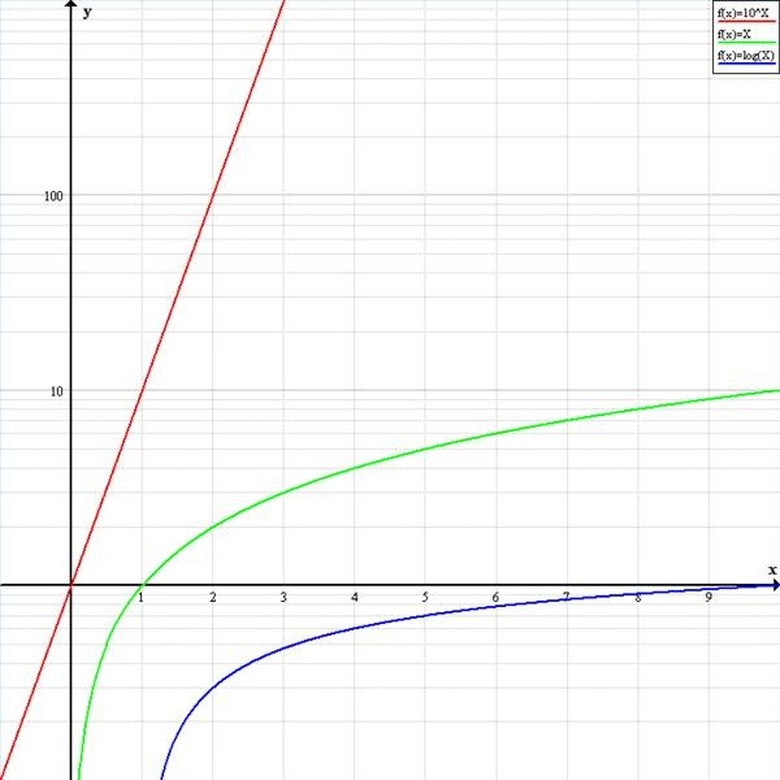
Use a log-lin graph. This type of log graph has a y axis with a logarithmic scale and an x axis with linear scale. The scale of the x axis is therefore expanded by a factor of 10^x in relation to the y axis. In the illustration, y = 10^x in red looks like y = x on the linear graph. Y = x in green looks like y = log10(x) on the linear graph, and y = log10(x) is below the x axis with a positive slope and approaches the x axis asymptotically.
References
Cite This Article
MLA
Robinson, Allan. "How To Create A Log Graph" sciencing.com, https://www.sciencing.com/how-to-create-a-log-graph-12751776/. 31 May 2013.
APA
Robinson, Allan. (2013, May 31). How To Create A Log Graph. sciencing.com. Retrieved from https://www.sciencing.com/how-to-create-a-log-graph-12751776/
Chicago
Robinson, Allan. How To Create A Log Graph last modified March 24, 2022. https://www.sciencing.com/how-to-create-a-log-graph-12751776/