Jobs That Use Math Slopes
Mathematical slope can be used to measure the steepness of a mountain, the growth of money in a bank account and the ups and downs of the national unemployment rate or a roller coaster. Its formula is based on changes in the "x" and "y" axes of a graph on which data is plotted. Understanding slope is an important work skill for many jobs, from architecture, which requires calculating roof pitch, to any job necessitating analysis of graphs.
Architect
Architect
Residential architects often must resolve roof pitch, which is based on a rise-over-run ratio. This ratio can be considered as such: Imagine the front of a gable divided into two right triangles. The horizontal distance from the bottom left tip of the gable to the vertical line dividing the triangles is the total run. The height from the imaginary horizontal line to the peak of the roof is the total rise. If a roof rises 6 inches for each horizontal 12 inches, it has a 6/12 slope or pitch.
Construction Worker
Construction Worker
Rise-over-run calculations must also be made when designing and building stairs. Along with architects, others involved in construction who need to understand this include carpenters and construction managers. Annenberg Media's Learner website diagrams a staircase to demonstrate total rise over run as well as the slope of the individual steps. Incorrect slope calculations can cause poor head room at the top of the stairs.
Market Research Analyst
Market Research Analyst
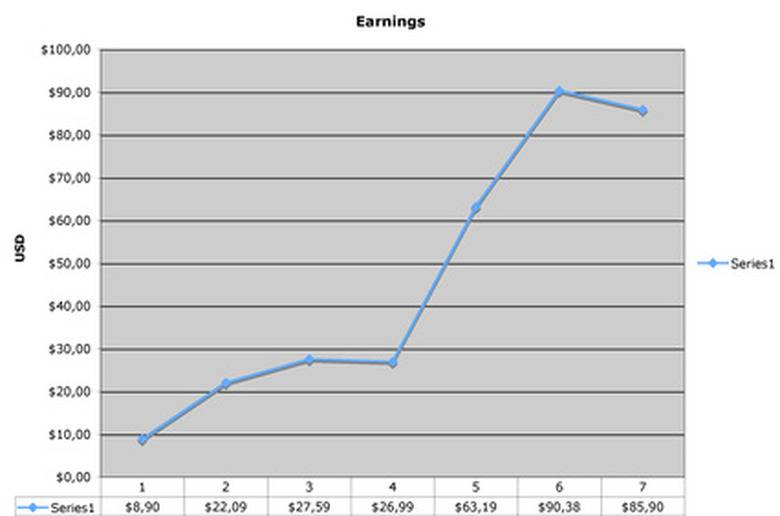
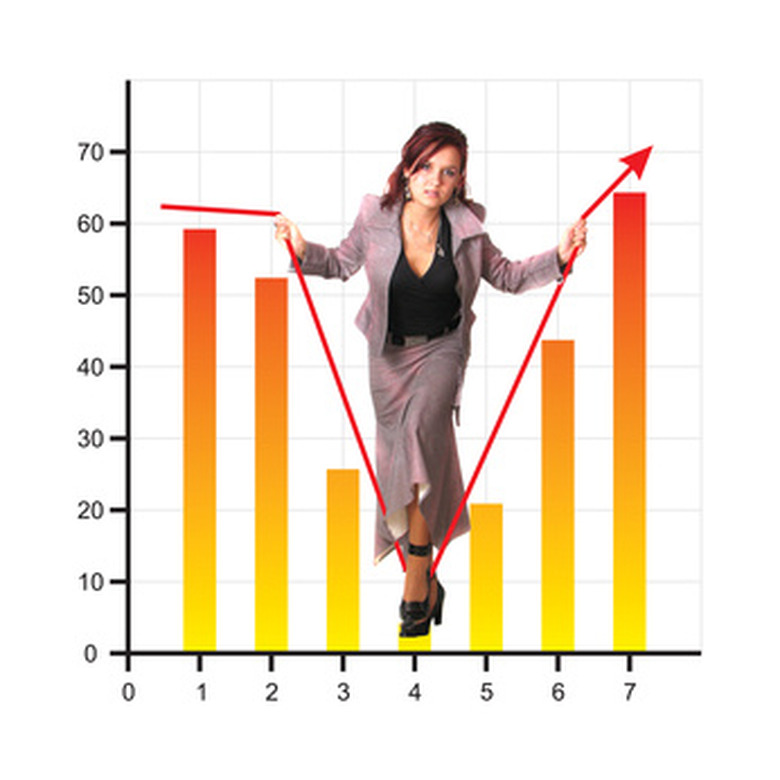
The website, "When Will I Use Math," says a market research analyst studies "statistical data on past sales to predict future sales." This requires the ability to construct and analyze visuals such as graphs illustrating whether trends are increasing or decreasing. A line traveling upward from the lower left of a graph means growth. If the angle is shallow, growth is weak. If it is steep, growth is strong. A line that goes down and then up may indicate a decline and then a recovery in sales.
Epidemiologist
Epidemiologist
The website, "When Will I Use Math," says epidemiologists use mathematical models to track progress of most infectious diseases. These models involve analyzing the slope of an epidemic. When epidemiologists graph such data, it follows an upward curve instead of a straight line because epidemics involve exponential leaps instead of growth at a constant rate of change. All scientists need to know how to interpret the slope of data presented in graph form.
Economist
Economist
Economists, social scientists who also work with graphical representations of data, may "collect and analyze data, monitor economic trends, or develop forecasts," according to "When Will I Use Math." Several sets of data about the same trend may be organized on one graph, which allows economists to make slope comparisons. Given enough sets of data over a long period of time, economists can forecast whether the slope will increase, meaning growth of the trend, or decrease, meaning that it is diminishing.
References
Cite This Article
MLA
Rudnicki, Alicia. "Jobs That Use Math Slopes" sciencing.com, https://www.sciencing.com/jobs-use-math-slopes-7231483/. 24 April 2017.
APA
Rudnicki, Alicia. (2017, April 24). Jobs That Use Math Slopes. sciencing.com. Retrieved from https://www.sciencing.com/jobs-use-math-slopes-7231483/
Chicago
Rudnicki, Alicia. Jobs That Use Math Slopes last modified August 30, 2022. https://www.sciencing.com/jobs-use-math-slopes-7231483/


