How To Determine If A Limit Exists By The Graph Of A Function
We are going to use some examples of functions and their graphs to show how we can determine whether the limit exists as x approaches a particular number.
Step 1
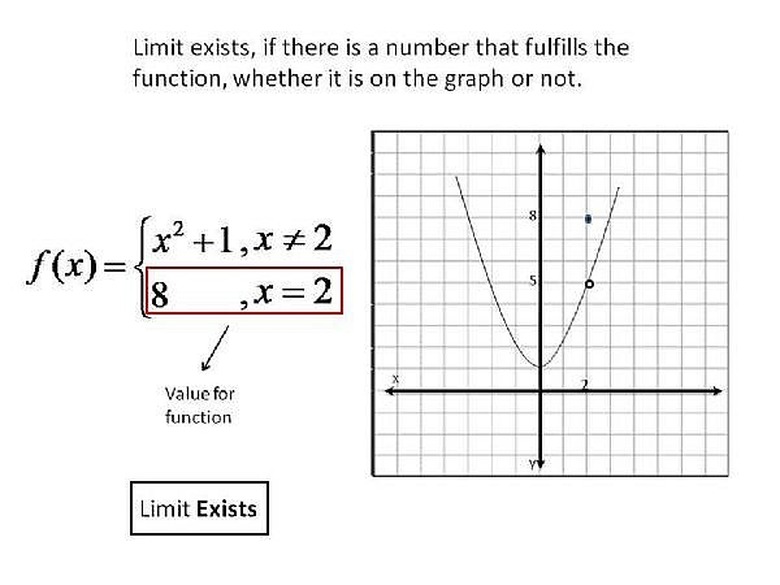
There are four different ways to determine if a limit exists by looking at the graph for the function. The first, which shows that the limit DOES exist, is if the graph has a hole in the line, with a point for that value of x on a different value of y. If this happens, then the limit exists, though it has a different value for the function than the value for the limit. Please click on the image for a better understanding.
Step 2
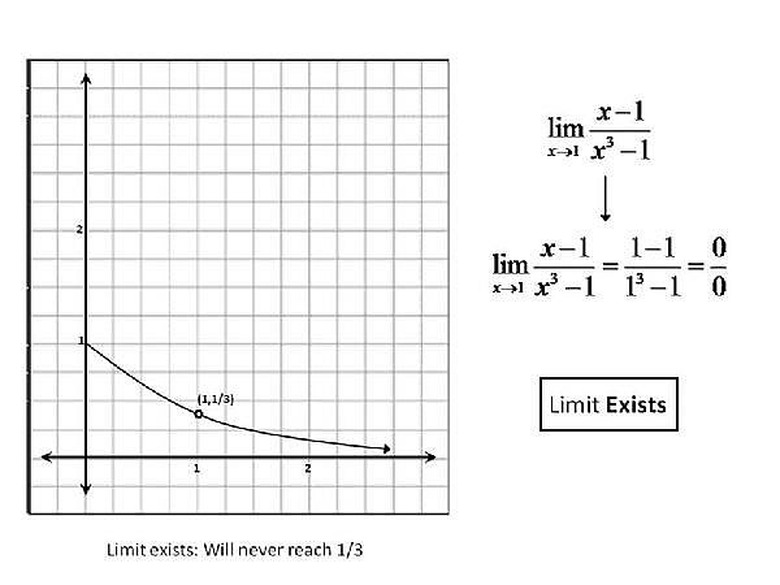
If there is a hole in the graph at the value that x is approaching, with no other point for a different value of the function, then the limit does still exist. Please see the graph for a better understanding.
Step 3
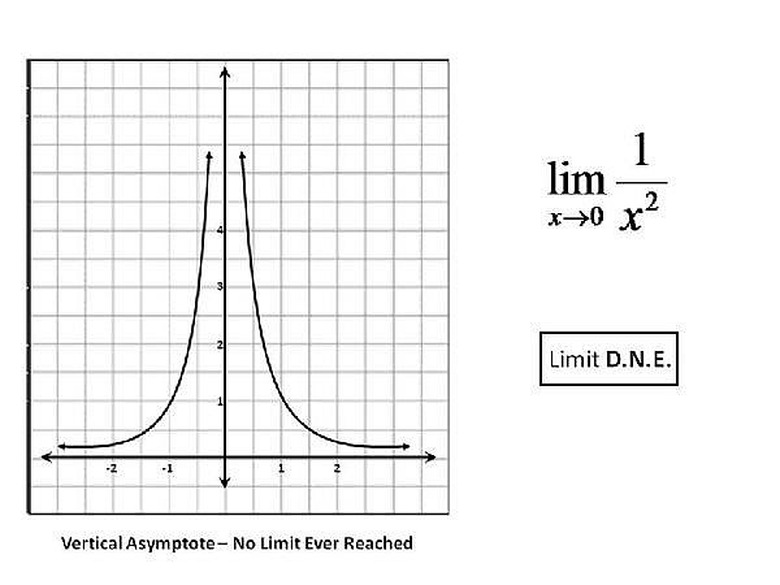
If the graph has a vertical asymptote, that is two lines approaching the value of the limit that continue up or down without bounds, then the limit does not exist. Please click on the image for a better understanding.
Step 4
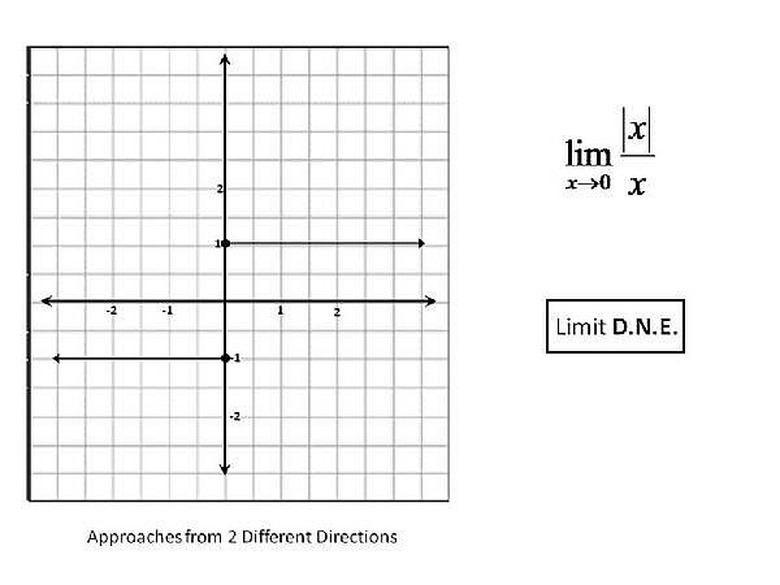
If the graph is approaching two different numbers from two different directions, as x approaches a particular number then the limit does not exist. It cannot be two different numbers. Please click on the image for a better understanding.
Things Needed
- Paper
- and Pencil
Cite This Article
MLA
Contributor, . "How To Determine If A Limit Exists By The Graph Of A Function" sciencing.com, https://www.sciencing.com/limit-exists-graph-of-function-4937923/. 24 April 2017.
APA
Contributor, . (2017, April 24). How To Determine If A Limit Exists By The Graph Of A Function. sciencing.com. Retrieved from https://www.sciencing.com/limit-exists-graph-of-function-4937923/
Chicago
Contributor, . How To Determine If A Limit Exists By The Graph Of A Function last modified March 24, 2022. https://www.sciencing.com/limit-exists-graph-of-function-4937923/


