How To Make A Data Table Online
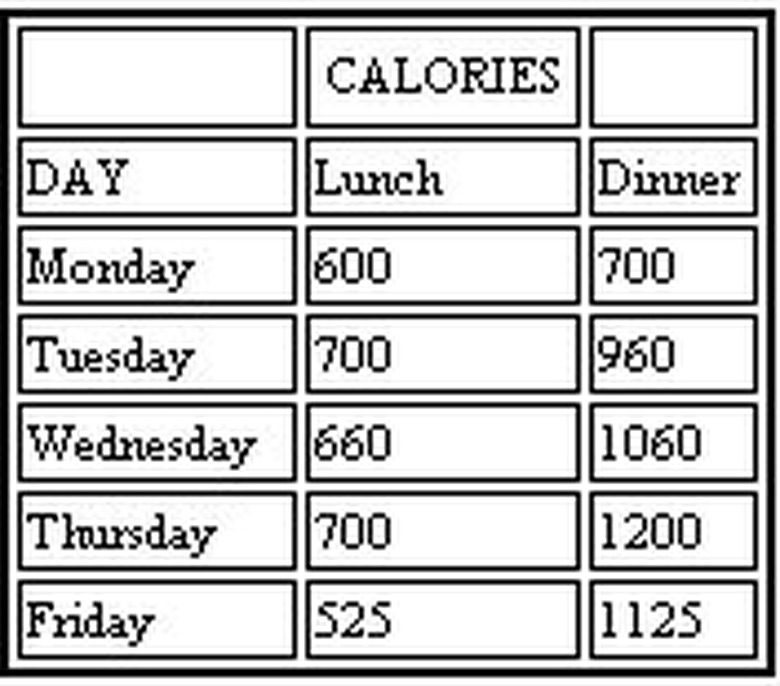
Data tables list various information in columns and rows for easy reading. The data is usually partly numerical with text labels. An example is a data table that shows how many calories someone eats each day.Making a data table online can be done with HTML or the more complex CSS browser language. The final table looks just like a data table created in a spreadsheet or on paper. The only difference is the background coding, which is not seen unless looking at the source code. The coding can be created by HTML editors, text, or other ways. There are many sites online that offer the ability to enter data, set a few attributes and create all of the table coding for you. Online data tables are usually used as part of a Web page. Data tables are often used to create lists of items with categories, such as items for sale. Some Web pages use them to show statistics for information. While data tables can be used offline for printing or in reports, it is usually better to use spreadsheet software, such as Microsoft Office Excel, which offer many more features for working with data.This guide shows how to create an HTML data table with Notepad.
Step 1
Open an HTML editor or just an ordinary Notepad text document to enter HTML code. Notepad works well if you are accustomed to HTML coding. HTML editors make repetitious tasks faster, but some, like Frontpage, add extra, unnecessary coding that can slow Web pages down. The best thing to do is code with an HTML editor first, then go back and edit the code by hand to clean it up.
Step 2
Decide the table attributes for the border, width, background color and font colors. You need to take into account the Web page layout, width, colors and other attributes to make the table easily readable. You also need to decide on how many rows and columns are needed for the data. Begin defining the table attributes. (Our example shows the number of calories eaten at lunch and dinner on each weekday. We need three columns (Day, Lunch and Dinner) and seven rows (two for labels and one for each weekday).
Step 3
Add a border around the table and data cells. Borders separate the data into cells for easy viewing. It is measured in pixels and can be given a value of 0 to not use them. A one or two-pixel border is generally fine. The tag for the border is
bgcolor=border="CHOSEN_BORDER_WIDTH"
The border color can be changed with the tag
bordercolor="CHOSEN_COLOR"
which utilizes the basic colors terms, such as red or black or six-digit hexadecimal color codes. Hexadecimals offer more colors. Our example uses border="2" and bordercolor="black".
Step 4
Determine the width of the whole table. It is measured in pixels or percent of screen size. Pixels are definitive and percentages allow the table to adjust to different screen sizes. Try to judge the width based on the width of the data across the rows. If you later find out the table is too thin or wide, it can be changed. Our example uses width="175".
Step 5
Set the background color of the data cells. It is different than the background color of the page, which can offer good contrast. The tag is
bgcolor="CHOSEN_COLOR"
just like the border color. Our example uses bgcolor="white".
Step 6
Set the font color of the text in the cells. Make sure the color contrasts well with the background, so it is easily readable. Light on dark or dark on light always work best. The tag is
font="CHOSEN_COLOR"
Our example is font="black", which contrasts well with the white background.
Step 7
Write out the complete table tags between a left and right arrow with a space between tag attributes and beginning with the table tag in front. The order of the tags does not matter, as long as "table" is out front.
Step 8
Determine the column widths. The width of each column depends on the width of the whole table. Take the table width and divide it by the number of cells to get evenly sized columns. If necessary, adjust the column widths, but the total cannot exceed the table width. When one cell width changes, the other cells need to be adjusted to total the table width. (Our example has a width of 175 and three columns per row, so an even-split of about 59. The actual split is 70, 60, 40.)
Step 9
Begin adding your data. First, begin a new line and add a table row with the code
. Next, add a table data tag. The bordercolor tag is used to specify the cell border color, if desired. If it is left out, the default table bordercolor is used. Our example's first cell code is:
Step 10
Repeat creating table data cells, each on a new line, until all cells in the row are complete. Then end the row with the tag
. Begin the next row with the same process, starting with the
tag again.Step 11
Close the table code with the with
|
Enter your data for the cell; using this code to represent blank cells: Close the cell with the tag |
|
tag. Our final table code, if ended after two rows of data, is below.
| | CALORIES | |
| Day | Lunch | Dinner |
| Monday | 450 | 800 |
| Tuesday | 600 | 720 |
Things Needed
- HTML editor or Notepad
- Data
Cite This Article
MLA
Gugie, John. "How To Make A Data Table Online" sciencing.com, https://www.sciencing.com/make-data-table-online-4480534/. 26 October 2020.
APA
Gugie, John. (2020, October 26). How To Make A Data Table Online. sciencing.com. Retrieved from https://www.sciencing.com/make-data-table-online-4480534/
Chicago
Gugie, John. How To Make A Data Table Online last modified March 24, 2022. https://www.sciencing.com/make-data-table-online-4480534/
