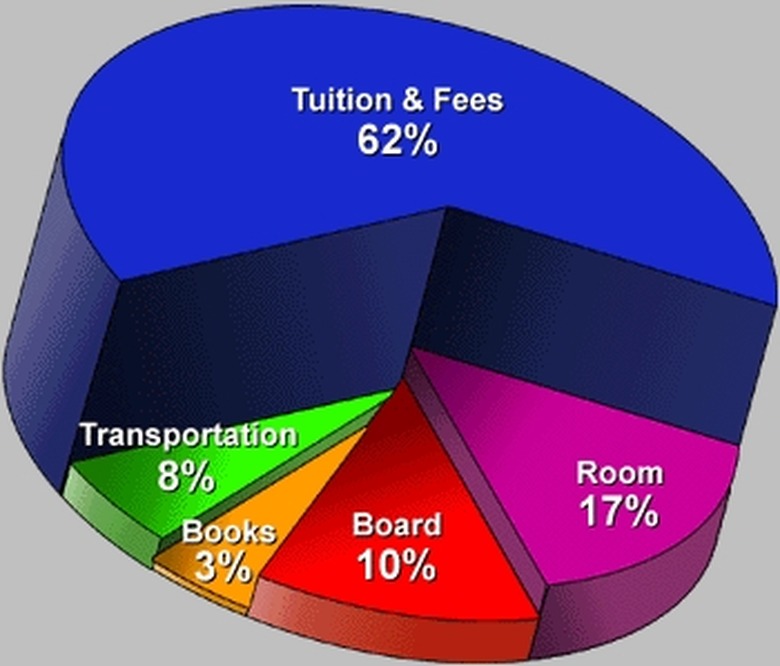
How To Make A Monthly Budget Circle Graph
Creating a monthly budget circle graph is an effective way to plan spending each month and is rather easy to do on a computer. Using the Microsoft Excel program, a circle graph is easy to customize to one's business needs and is just a few clicks away.
Step 1
Input the budget data into the given Microsoft Excel cells vertically. Since you are making a circle graph, the data will add up to 100%, but not necessarily the number 100. The data should fill cells A1 and downward.
Step 2
Click "Insert" at the top of the screen, move the mouse down to "Chart" and click.
Step 3
Choose the "Pie" option for the type of graph. This is under Step 1 of the "Chart Wizard." Click "Next" at the bottom of the window.
Step 4
Click the symbol to the right of the blank labeled "Data Range."
Step 5
Drag the mouse across the data in the cells behind the window. To reenter the "Chart Wizard," click the symbol to the right of the blank again.
Step 6
Click the "Series" Tab at the top of the window. Name Series One the first budget item.
Step 7
Add series as needed to fit the budget items on the list. Press "Next" when finished.
Step 8
Title your chart by filling in the "Chart Title" field.
Step 9
Click "Finish" to create the circle graph.
Step 10
Optimize the budget graph as needed by right-clicking it. When finished, print the graph.
Things Needed
- Computer
- Printer
- Microsoft Excel software
TL;DR (Too Long; Didn't Read)
There are several versions of Microsoft Excel, so if a term seems different, find the closest related term. For instance "Pie Graph" may be called "Circle Graph" in some versions.
Warning
Be sure to correctly enter the data before creating the graph. If this is not done correctly, the graph will not accurately represent the data.
Cite This Article
MLA
Becker, Scott. "How To Make A Monthly Budget Circle Graph" sciencing.com, https://www.sciencing.com/make-monthly-budget-circle-graph-4474031/. 24 April 2017.
APA
Becker, Scott. (2017, April 24). How To Make A Monthly Budget Circle Graph. sciencing.com. Retrieved from https://www.sciencing.com/make-monthly-budget-circle-graph-4474031/
Chicago
Becker, Scott. How To Make A Monthly Budget Circle Graph last modified March 24, 2022. https://www.sciencing.com/make-monthly-budget-circle-graph-4474031/
