How To Find Ratios On Charts
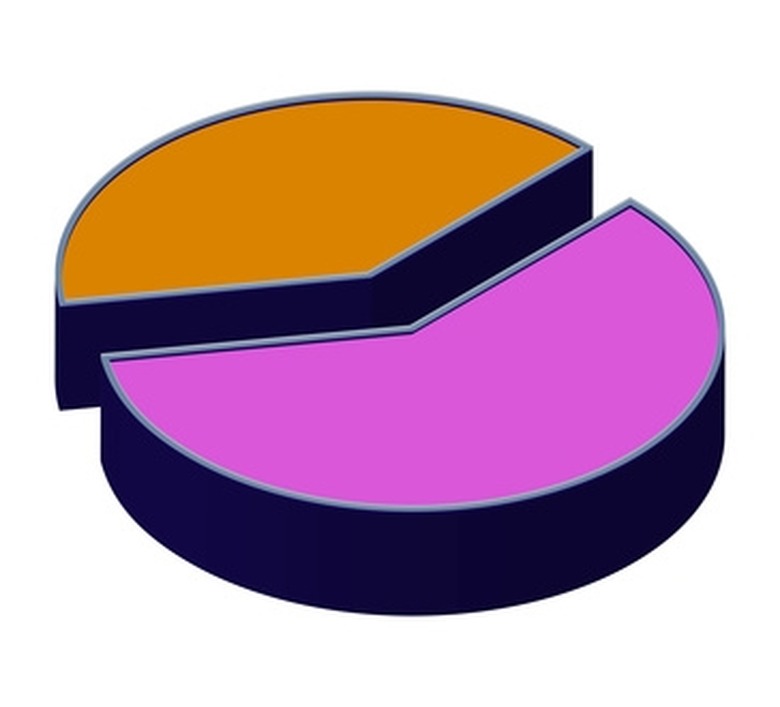
Creating a chart allows you to create a physical representation of figures that you have collected. A chart can be shown in a variety of different ways, such as pie, bar and line charts. The ratio of a chart is the total of one of the figures in comparison to the total number of figures you collected, represented in its lowest possible figures. Therefore, the ratio of a chart would be the proportion of each number in the chart based on the collective total.
Step 1
Write down the number of each individual section of the chart. For example, if it is a pie chart, write down the percentage for each slice. For a bar or line chart, write down the total of each bar.
Step 2
Work out the ratio of each percentage slice in a pie chart by dividing the percentage by 10. This will give you the lowest possible whole number representation. You divide it by 10 because 10 would represent 100 percent. For example, if the slice represented 40 percent, divide 40 by 10 to give you 4. This would mean your ratio for that slice in comparison with the entire pie chart is 4:10. As both numbers can be divided into lower whole numbers, this becomes 2:5.
Step 3
Divide two percentages separately by 10 if you wish to work out the ratio between two different percentage slices in the chart. For example, if you had a slice that was 40 percent and another that was 20 percent, divide them both by 10 to give you 4 and 2. This would mean your ratio is 4:2. However, like earlier, this ratio can be broken down into a lower whole number. Therefore, it becomes 2:1
Step 4
Divine the total number of the entire chart by the number of a single line or bar to give you the ratio in a bar or line chart. For example, if a bar or line represented 5 in a chart with a total of 30, you would divide 30 by 5. This would give you a result of 6. Therefore, the ratio would be 6:1.
References
Cite This Article
MLA
Johnston, John. "How To Find Ratios On Charts" sciencing.com, https://www.sciencing.com/ratios-charts-8593030/. 24 April 2017.
APA
Johnston, John. (2017, April 24). How To Find Ratios On Charts. sciencing.com. Retrieved from https://www.sciencing.com/ratios-charts-8593030/
Chicago
Johnston, John. How To Find Ratios On Charts last modified March 24, 2022. https://www.sciencing.com/ratios-charts-8593030/
