How To Sketch The Graph Of Square Root Functions, ( F(x)=√ X )
This Article will show how to Sketch the graphs of Square Root Function by using only three different values for ' x ',then finding the Points through which the graph of the Equations/Functions are drawn, also it will show how the Graphs Vertically Translates ( moves up or down ), Horizontally Translates ( moves to the left or to the right ), and how the Graph simultaneously does Both Translations.
Step 1
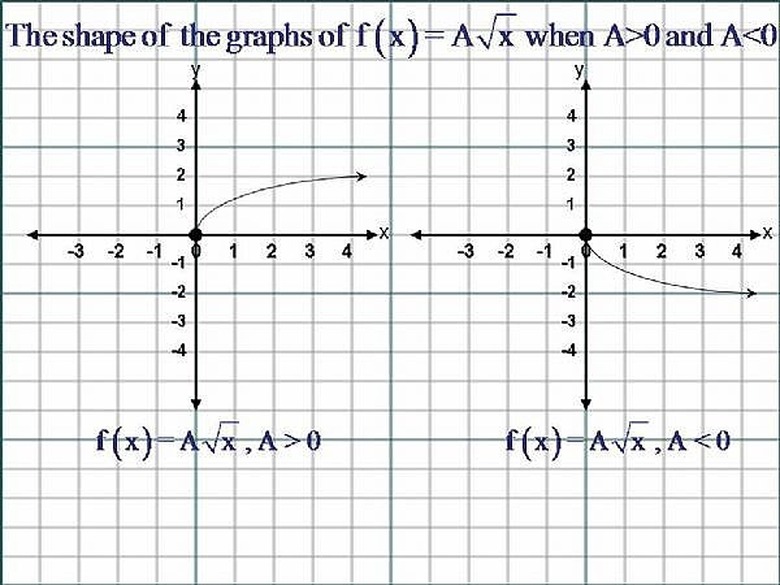
The Equation of a Square Root Function has the Form,... y = f(x) = A√x ,where ( A ) must not be equal to zero ( 0 ).If ( A ) is greater than Zero ( 0 ), that is ( A ) is a Positive Number, then The Shape of the Graph of the Square Root Function is similar to the Upper Half of the letter,' C '. If ( A ) is Less than Zero ( 0 ), that is ( A ) is a Negative Number, the Shape of the Graph is similar to that of the Lower Half of the letter ' C '. Please Click on the Image for a better view.
Step 2
To Sketch the Graph of The Equation,... y = f(x) = A√x, we choose Three Values for ' x ', x = ( -1 ), x = ( 0 ) and x = ( 1 ). We substitute each value of ' x ' into the Equation,... y = f(x) = A√x and get the respective corresponding value for each ' y '.
Step 3
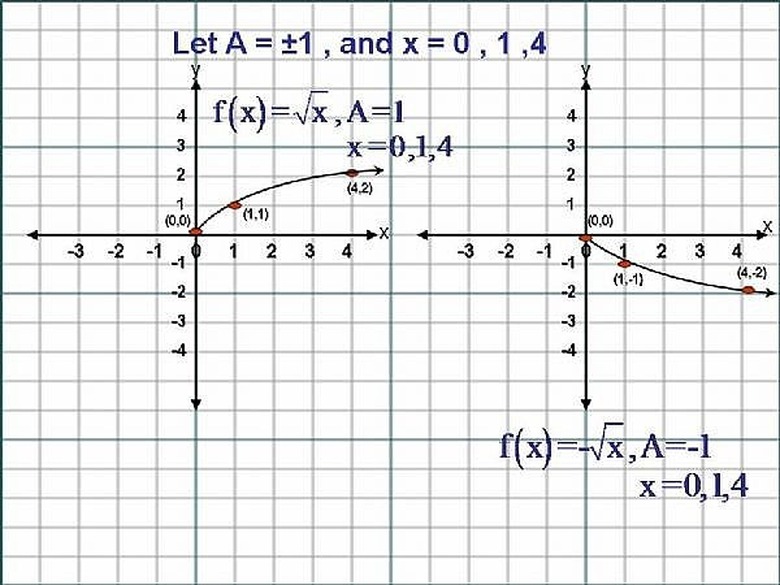
Given y = f(x) = A√x, where ( A ) is a Real Number and ( A ) not equal to Zero ( 0 ), and substituting, x = ( -1 ) into the Equation we get y = f(-1) = A√(-1) = i ( which is an imaginary number). So the First Point has no real coordinates, therefore, no graph can be drawn through this point. Now Substituting, x = ( 0 ), we get y = f(0) = A√(0) = A(0)= 0. So the Second Point has Coordinates (0,0). And Substituting x = ( 1 ) we get y = f(1) = A√(1) = A(1) = A. So the Third Point has Coordinates (1,A). Since the first Point had coordinates that were not real, we now look for a fourth Point and choose x =(2). Now substitute x =(2) into y =f(2) = A√(2) = A(1.41)= 1.41A . So the fourth Point has coordinates (2,1.41A). We now Sketch the Curve through these Three Points. Please Click on the Image for a better view.
Step 4
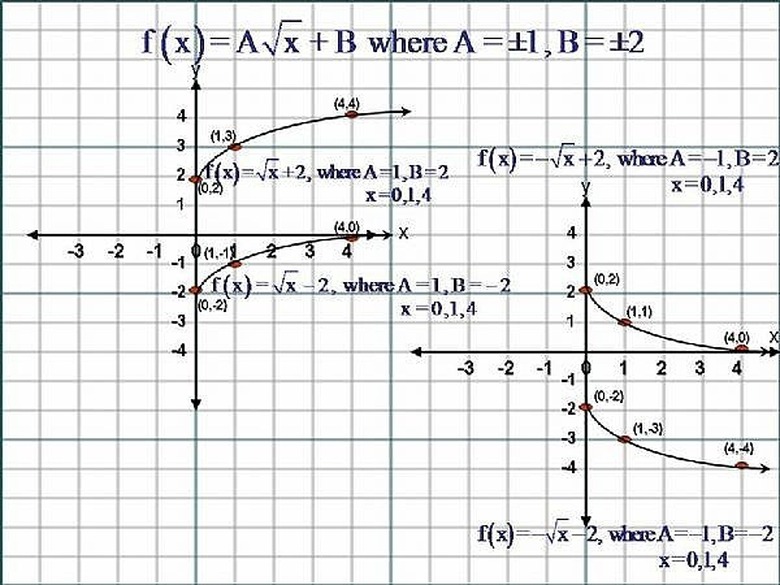
Given the Equation y = f(x) = A√x + B, where B is any Real Number, the Graph of this Equation would Translate Vertically ( B ) units. If ( B ) is a Positive Number, the Graph will move up ( B ) units, and if ( B ) is a Negative Number, the Graph will move down ( B ) units. To Sketch The Graphs of this Equation, We follow the Instructions and use the same values of ' x ' of Step #3. Please Click on the Image to get a better view.
Step 5
Given the Equation y = f(x) = A√(x – B) where A and B are any Real Numbers, and ( A ) not equal to Zero ( 0 ), and x ≥ B. The Graph of this Equation would Translate Horizontally ( B ) units. If ( B ) is a Positive Number, the Graph will move to the Right ( B ) units and if ( B ) is a Negative Number, the Graph will move to the Left ( B ) units. To Sketch The Graphs of this Equation, we First set the Expression,' x – B ', that is under the radical sign Greater than or Equal to Zero, and solve for ' x '. That is,... x – B ≥ 0, then x ≥ B.
Step 6
We will now use the following Three Values for ' x ', x = (B), x = ( B + 1 ) and x = ( B + 2 ) . We substitute each value of ' x ' into the Equation,... y = f(x) = A√(x – B)and get the respective corresponding value for each ' y '.
Step 7
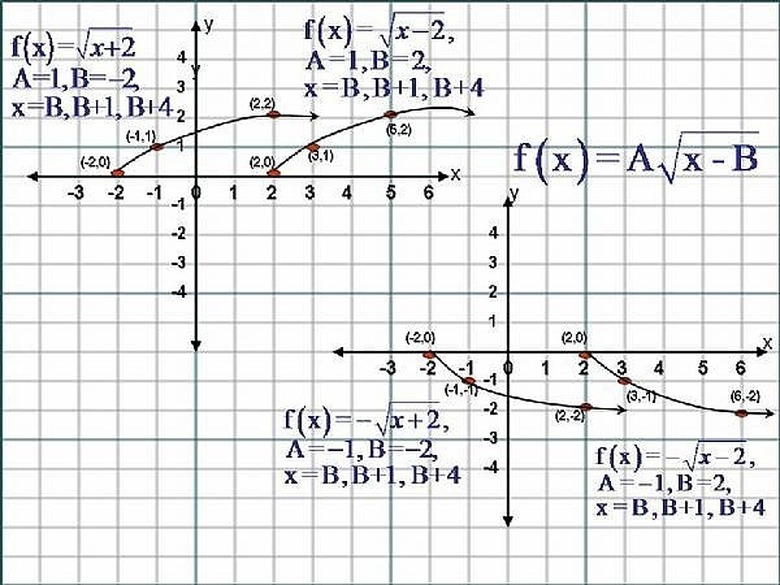
Given y = f(x) = A√(x – B), where A and B are Real Numbers, and ( A ) not equal to Zero ( o ) where x ≥ B. Substituting, x = (B) into the Equation we get y = f(B) = A√(B-B) = A√(0) = A(0) = 0. So the First Point has Coordinates (B,0). Now Substituting, x = ( B + 1 ), we get y = f(B + 1) = A√(B + 1 – B) = A√1 = A(1) = A. So the Second Point has Coordinates (B+1,A),and Substituting x = ( B + 2 )we get y = f(B+2) = A√( B+2-B) = A√(2) =A(1.41) = 1.41A. So the Third Point has coordinates (B+2,1.41A). We now Sketch the Curve through these Three Points. Please Click on the Image for a better view.
Step 8
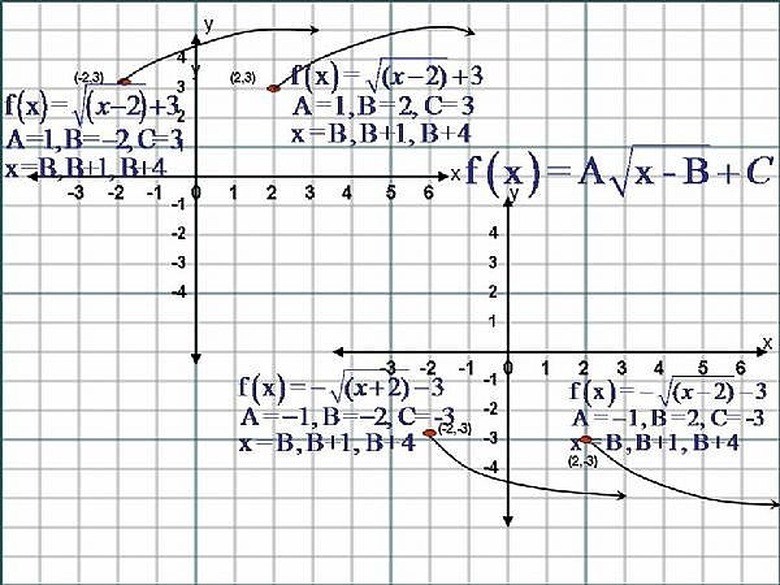
Given y = f(x) = A√(x – B) + C, where A, B, C are Real Numbers and ( A )not equal to Zero ( 0 ) and x ≥ B. If C is a Positive Number then the Graph in STEP #7 Will Translate Vertically ( C ) units. If ( C ) is a Positive Number, the Graph will move up ( C ) units, and if ( C ) is a Negative Number, the Graph will move down ( C ) units. To Sketch The Graphs of this Equation, We follow the Instructions and use the same values of ' x ' of Step #7. Please Click on the Image to get a better view.
Things Needed
- Paper
- Pencil and
- Graph Paper
Cite This Article
MLA
Reid, Zadock. "How To Sketch The Graph Of Square Root Functions, ( F(x)=√ X )" sciencing.com, https://www.sciencing.com/square-root-functions-fx-x-4515289/. 24 April 2017.
APA
Reid, Zadock. (2017, April 24). How To Sketch The Graph Of Square Root Functions, ( F(x)=√ X ). sciencing.com. Retrieved from https://www.sciencing.com/square-root-functions-fx-x-4515289/
Chicago
Reid, Zadock. How To Sketch The Graph Of Square Root Functions, ( F(x)=√ X ) last modified March 24, 2022. https://www.sciencing.com/square-root-functions-fx-x-4515289/