Statistics Project Ideas
Statistics is a branch of mathematics concerned with interpreting the world from the standpoint of probability. It helps people understand trends, so they can make predictions about events that have not yet happened based on information collected about things that have already happened. For example, statistics can be used to determine the likelihood of someone from a given part of the United States favoring one model of car over another, data that is useful to advertisers. It can also be used to evaluate the wisdom of upcoming moves in games, such as chess or poker.
Explored properly and scaled to the right learning level, statistics projects can be a lot of fun for kids and can stimulate age-appropriate learning discussions in the classroom.
Coin Flip Project
Coin Flip Project
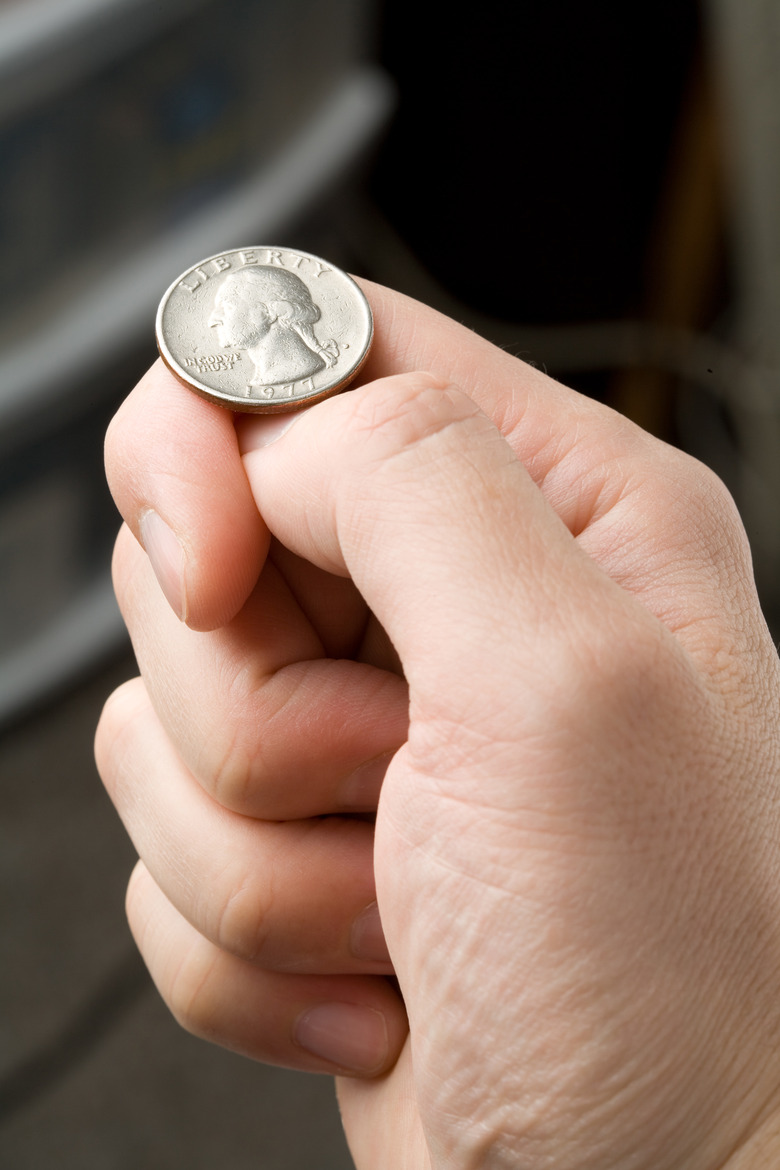
A time-honored statistics project for youngsters involves flipping a penny or other coin. This project plays into the intuition of younger students, who typically learn that "heads" and "tails" are equally likely outcomes of any fair coin flip.
In this project, students flip a coin 50 times and record the number of heads and tails. They can then be asked how many of each result they expected and why. The results of the entire class can be pooled and printed for the project. Students can then be prodded for possible reasons for discrepancies between their individual results and their predicted results.
Bell Curve Project
Bell Curve Project
Middle-school students are old enough to be exposed to the concept of a statistical bell curve. Start by looking at a graph of, say, the heights of a population with the number of people at each height on the Y-axis and the height values themselves on the X-axis. Have students try to come up with other measures that might display a bell-curve distribution, such as grades on a quiz or how fast people can run 100 meters. Students can then hypothesize about why results like these tend to cluster around a center, and their ideas can constitute the basis for a project for the class such as a poster.
Powerball Project
Powerball Project
High-school students can figure out for themselves the odds of winning perhaps the most famous lottery in the United States – the Powerball – in which ticket buyers select five "regular" numbers from a pool of 69 along with one Powerball from a pool of 26. First, ask the students to defend or refute the idea that choosing one's own numbers gives a statistically better chance of winning than allowing the machine to pick for them.
This project may be the students' first introduction to the concept of factorials, an understanding of which is necessary for the successful completion of the project. The associated lessons allow students to appreciate the difference in calculating contingent probabilities as with the first five numbers and calculating the probability of independent events occurring at the same time, such as with the probability of selecting both the five correct regular balls and the one winning Powerball.
Cite This Article
MLA
Beck, Kevin. "Statistics Project Ideas" sciencing.com, https://www.sciencing.com/statistics-project-ideas-13710544/. 23 March 2018.
APA
Beck, Kevin. (2018, March 23). Statistics Project Ideas. sciencing.com. Retrieved from https://www.sciencing.com/statistics-project-ideas-13710544/
Chicago
Beck, Kevin. Statistics Project Ideas last modified August 30, 2022. https://www.sciencing.com/statistics-project-ideas-13710544/
