How To Work Out A Gradient Of A Curve
In mathematics, a line graph is used to represent the values of a function. Functions of x that do not contain exponents (such as x=y or y=2x+1) are linear in nature, so the gradient (rise over run) is simple to calculate.
Functions of x that contain exponents (such as y=2x^2 +1) are more difficult to calculate, since the y-component of the line may curve in relation to the x-axis.
Step 1
Calculate the corresponding "Y-axis" values of ten "X-axis" numbers. For example, if y=x^2, calculate the Y-axis values for X where X equals -5, -4, -3, -2, -1, 0, 1, 2, 3 and 4. Plot these values on the graphing paper, where the X value is the horizontal axis, and the Y value is the vertical axis.
Step 2
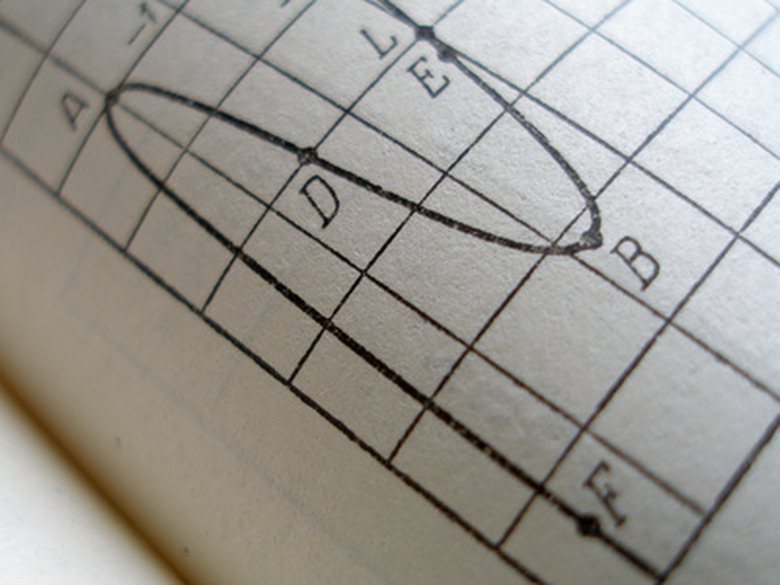
Choose two ascending points on the graph (such as "X=2" and "X=3"). Draw a straight line from one point to the other.
Step 3
Count the number of lines on the vertical axis between the two points, and write this number down as the numerator. Count the number of lines on the horizontal axis between the two points, and write this number down as the denominator. The gradient is the numerator divided by the denominator.
Things Needed
- Mathematical function of X (such as "y=x^2")
- Scientific calculator
- Graph paper
- Pen or pencil
- Protractor
TL;DR (Too Long; Didn't Read)
Since a slope of a curve is constantly changing, the gradient will vary between any two points. As such, a any gradient measurement must be performed at one point or between a set of two points, as opposed to along the whole curve.
Cite This Article
MLA
Sandoval, David. "How To Work Out A Gradient Of A Curve" sciencing.com, https://www.sciencing.com/work-out-gradient-curve-6547320/. 24 April 2017.
APA
Sandoval, David. (2017, April 24). How To Work Out A Gradient Of A Curve. sciencing.com. Retrieved from https://www.sciencing.com/work-out-gradient-curve-6547320/
Chicago
Sandoval, David. How To Work Out A Gradient Of A Curve last modified March 24, 2022. https://www.sciencing.com/work-out-gradient-curve-6547320/