March Madness Predictions: Statistics To Help You Fill Out A Winning Bracket
March Madness. The NCAA Tournament. The Big Dance. Whatever you call it, the biggest month in college basketball has arrived, and the beautiful thing about March Madness is you don't need to be a die-hard sports fan to participate.
The single-elimination tournament pits 64 of the best teams in men's college basketball against each other, and while the players duke it out on the court, friend groups and workplaces around the country compete to see who can correctly predict the results of each game in the tournament.
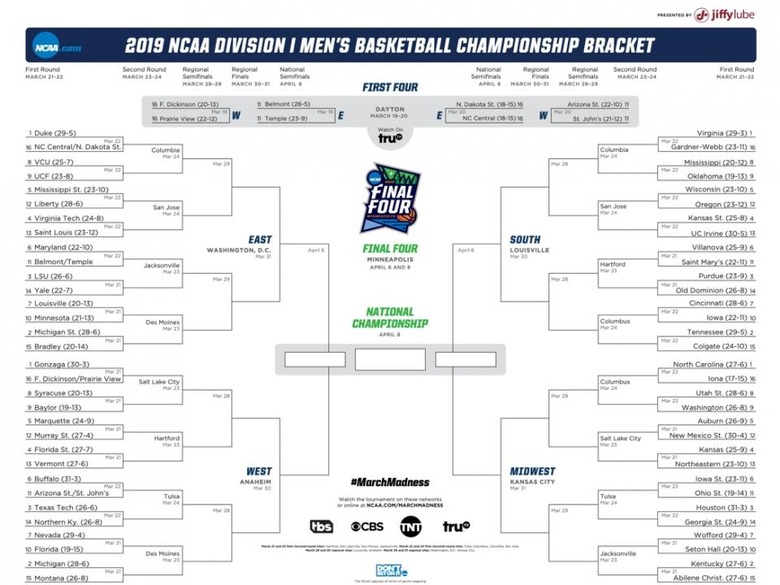
Here's this year's bracket:
Anyone can fill out a bracket, and based on how insanely tough it is to get a perfect bracket, there's no tried-and-true formula to picking winners. If you're participating for the first time, we're here to make it easier.
Statistics play a big role in March Madness, and you don't have to understand advanced metrics or basketball jargon to have data on your side. Simply looking at how teams have done in the past reveals a lot of trends, and can give you a big leg up on your bracket opponents.
Sciencing's data science team has scoured the March Madness history books to prep you for to the 2019 tournament.
How Teams are Ranked
How Teams are Ranked
We won't get too deep into the seeding process, but what you need to know is this: The main 64 teams are divided into four regions (West, South, Midwest, East) and ranked from No. 1 to No. 16 in each region. Our statistics are mainly centered around historical win percentage based on these seedings.
A few things to note, before we hop in:
1. **The Numbers:** Our stats only date back to 1985, the first year March Madness included 64 teams. 2. **Seeds:** When we say "higher" seed, we mean the higher number, so the weaker team. No. 1 is the lowest seed. No. 16 is the highest seed. 3. **Defining an upset:** Folks have different definitions of what constitutes on upset. A seed difference of five or higher between the winning team and losing team is considered an upset by our standards
Safe Predictions
Safe Predictions
These are some picks you can pretty safely count on. Don't think twice when checking your own bracket against these predictions:
- **A top three seed will win the tournament.** There's about an 88 percent chance that this year's March Madness champ will be either a No. 1, No. 2 or No. 3 seed.
- At least one upset will occur throughout the tournament.
- Not all four No. 1 seeds will make it to the Final Four, but there will at least be one No. 1 seed in the Final Four.
- No seed lower than No. 8 will make it to the championship game.
- At least one of the top four seeds will make it to the championship game.
_Click here if you want a closer look at our team's full dataset._
Ambitious Predictions
Ambitious Predictions
So you're feeling a little aggressive, huh? If you're looking for some high-risk, high-reward moves, we've got some predictions.
- At least eight upsets will occur throughout the tournament.
- At least one team with a higher seed than No. 5 will make it to the Final Four.
From here, we'll go ahead and offer you statistics based on each round in the tournament.
Round of 64
Round of 64
**Upsets:**
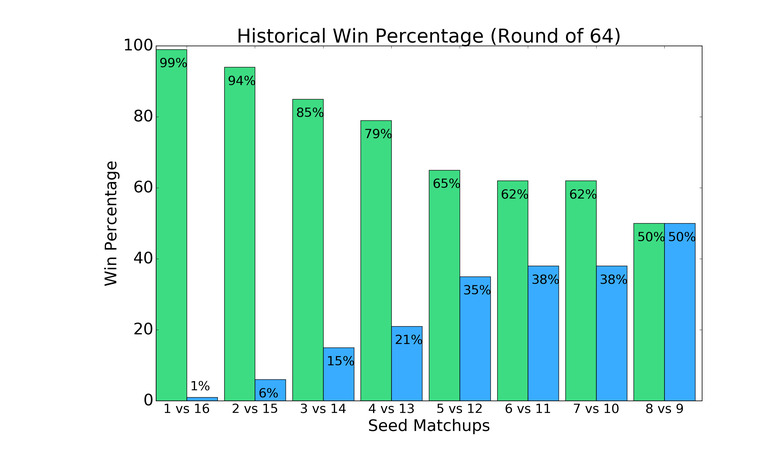
There have been ~4.6 upsets on an average in the Round of 64 every year. Here are the most common matchups to result in an upset:
- 11 vs 6: 51 times
- 12 vs 5: 47 times
- 13 vs 4: 28 times
- 14 vs 3: 21 times
- 15 vs 2: 8 times
Round of 32
Round of 32
Matchups not listed above:
- 7 (2 wins) vs 15 (1 win)
- 9 (1 win) vs 16
- 10 (5 wins) vs 15
- 11 (5 wins) vs 14
**Upsets:**
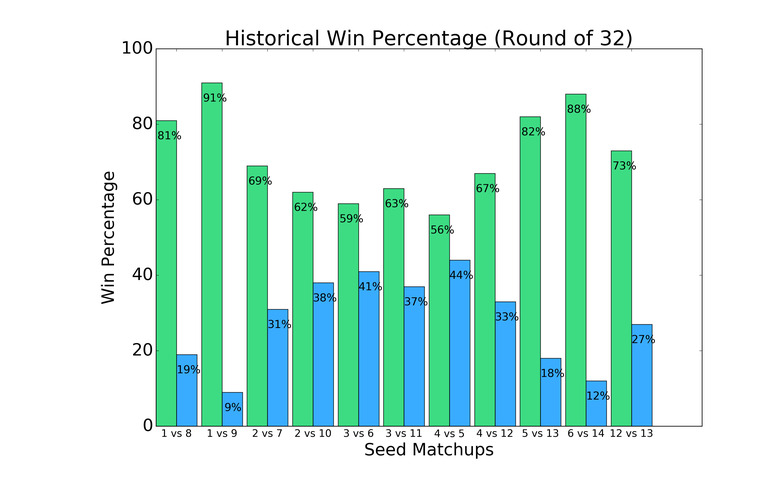
There have been ~2.9 upsets on an average in the Round of 32 every year. Here are the most common pairings to result in an upset:
- 7 vs 2: 25 times
- 10 vs 2: 18 times
- 11 vs 3: 17 times
- 8 vs 1: 13 times
- 12 vs 4: 12 times
Sweet Sixteen
Sweet Sixteen
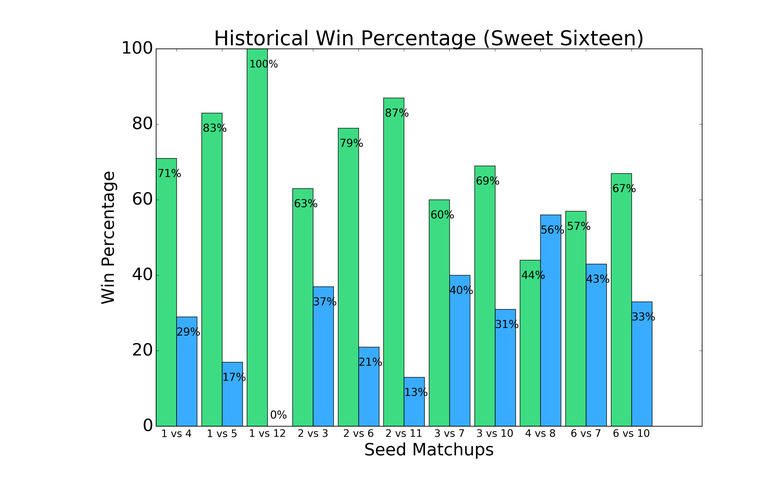
Matchups not shown above:
- 1 (4 wins) vs 13
- 3 (1 win) vs 15
- 4 (2 wins) vs 9 (1 win)
- 5 vs 8 (2 wins)
- 5 (1 win) vs 9 (2 wins)
- 7 vs 11 (4 wins)
- 7 (1 win) vs 14
- 8 vs 12 (1 win)
- 8 (1 win) vs 13
- 9 (1 win) vs 13
- 10 (1 win) vs 11 (2 wins)
- 10 (1 win) vs 14
**Upsets:**
There have been ~0.21 upsets on an average in the Sweet Sixteen every year or one upset every five years. The following are the only three pairings to result in an upset:
- 10 vs 3: 4 times
- 11 vs 2: 2 times
- 9 vs 4: 1 time
Elite Eight
Elite Eight
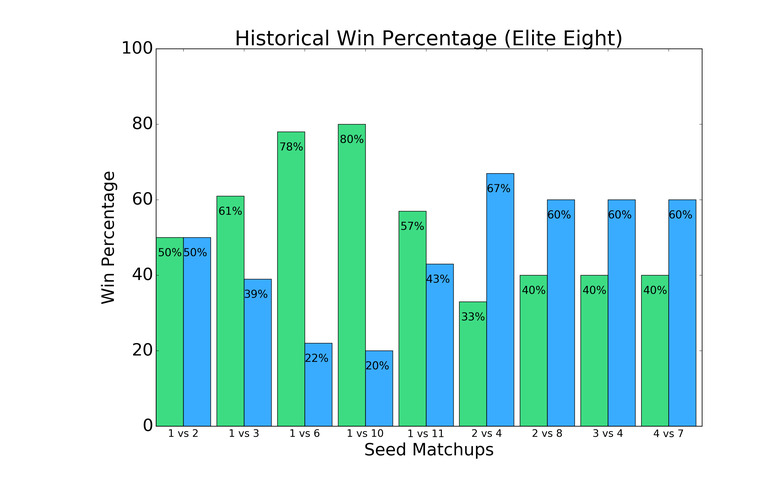
Matchups not listed above:
- 1 (4 wins) vs 7
- 2 vs 5 (3 wins)
- 2 vs 9 (1 win)
- 2 (1 win) vs 12
- 3 (2 win) vs 5 (1 win)
- 3 (1 win) vs 8
- 3 (2 wins) vs 9
- 4 (2 wins) vs 6 (1 win)
- 4 (2 wins) vs 10
- 5 (1 win) vs 6
- 5 (1 win) vs 10
- 6 vs 8 (1 win)
- 7 vs 8 (1 win)
- 9 vs 11 (1 win)
**Upsets:**
There have been ~0.3 upsets on an average in the Elite Eight every year or approximately one upset every three years.
The Elite Eight is more likely to feature an upset than the Sweet Sixteen.
Following are the only five pairings to result in an upset:
- 11 vs 1: 3 times
- 8 vs 2: 3 times
- 6 vs 1: 2 times
- 10 vs 1: 1 time
- 9 vs 2: 1 time
Final Four
Final Four
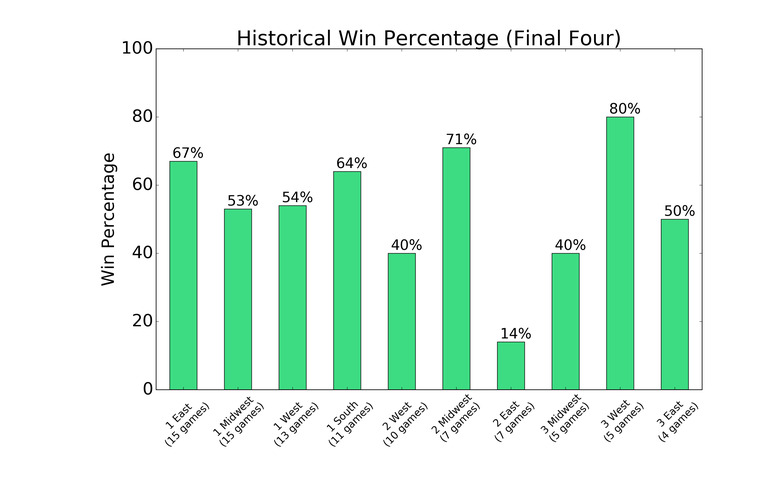
There's been only one instance of the Final Four featuring exclusively No. 1 seeds. UCLA, Memphis, Kansas and North Carolina completed the feat in 2008, which proves it's unlikely that all four No. 1 seeds will make the Final Four.
\(\def\arraystretch{1.5}
\begin{array}{c:c:c:c}
Final \;Four\;Seed\;Distribution& Occurences\;Since\;1985 \ \hline
At \; least \;one \;No.\; 1\;seed & 32/34 \
\hdashline
At\;least\;one\;No.\;2\;seed & 22/34 \
\hdashline
At\;least\;one\;top\;four\;seed & 34/34
\end{array}\)
- Both No. 8 and No. 11 seeds have made it to Final Four on four occasions each, which is more than the No. 6, No. 7, No. 9, No. 10 and No. 12-16 seeds.
- No seed from No. 12 through No. 16 has ever made it to the Final Four.
- There has been at least one seed higher than No. 6 in recent years (since 2013).
**Final Four seeds since 2013:**
\(\def\arraystretch{1.5}
\begin{array}{c:c:c:c}
Year & Seeds\;in\;Final\;Four \ \hline
2018 & 1, 1,3,11 \
\hdashline
2017 & 1,7,1,3 \
\hdashline
2016 & 1,10,2,2\
\hdashline
2015 & 1,7,1,1\
\hdashline
2014 & 7,1,8,2\
\hdashline
2013 & 1,9,4,4
\end{array}\)
**Upsets:**
There have been ~0.09 upsets on an average in the Final Four every year, or about one upset every eleven years. The following are the only two matchups to result in an upset:
- 8 vs 2: 2 times
- 7 vs 1: 1 time
National Championship
National Championship
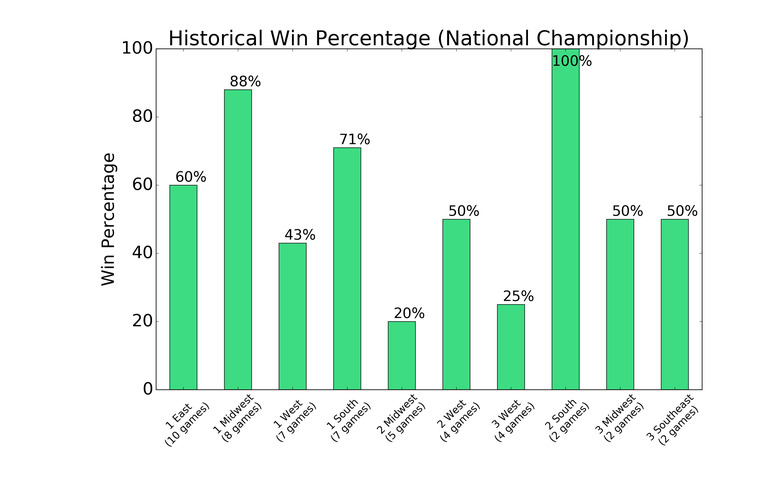
No seeds from No. 9-16 have ever made it to finals, so it's probably not the best idea to pick one of those as your winner.
\(\def\arraystretch{1.5}
\begin{array}{c:c:c:c}
Finals\;Seed\;Distribution & Occurrences\;Since\;1985\ \hline
Both\;seeds\;are\;No.\;1 & 7/34 \
\hdashline
At\;least\;one\;No.\;1\;seed & 26/34 \
\hdashline
At\;least\;one\;No.\;2\;seed & 13/34\
\hdashline
At\;least\;one\;top\;four\;seed & 33/34\
\end{array}\)
The No. 8 seed has made the finals three times which is historically fewer times than only the top three seeds:
\(\def\arraystretch{1.5}
\begin{array}{c:c:c:c}
Seed & Appearaces\;in\;Championship\ \hline
No.\;1 & 26\
\hdashline
No.\;2 & 13 \
\hdashline
No.\;3& 9\
\hdashline
No.\;8 & 3\
\end{array}\)
The only time when none of the top four seeds made it to finals was in 2014 (No. 7 vs. No. 8).
**Finalists in recent years:**
\(\def\arraystretch{1.5}
\begin{array}{c:c:c:c}
Year & Seed\;Matchup \ \hline
2018 & 1\;vs.\;3 \
\hdashline
2017 & 1\;vs.\;1 \
\hdashline
2016 & 2\;vs.\;1\
\hdashline
2015 & 1\;vs.\;1\
\hdashline
2014 & 7\;vs.\;8\
\hdashline
2013 & 1\;vs.\;4
\end{array}\)
**Results:**
- A top-three seed has won 30 out of 34 times
- A No.1 seed has won 21 out of 34 times.
**Upsets:**
There have been ~0.06 upsets on an average in the National Championship every year or about one upset every seventeen years. These are the only two pairings to result in an upset:
- 8 vs 1: 1 time
- 6 vs 1: 1 time
Upset Analysis
Upset Analysis
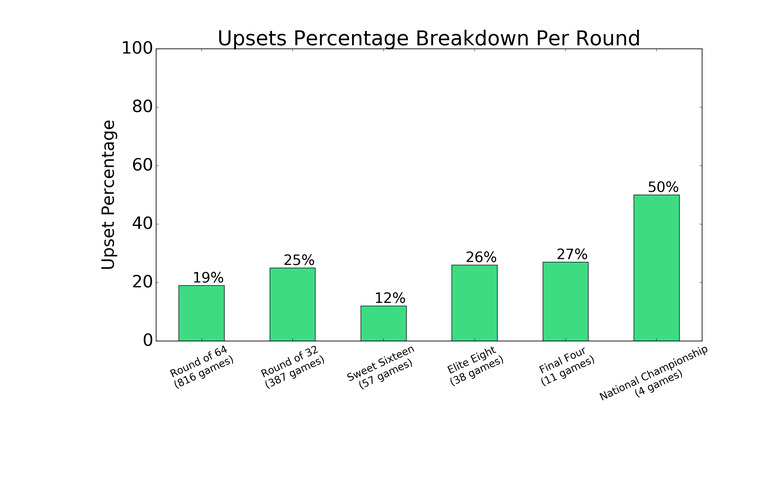
The graph above shows upset percentage by round since 1985. It's important to note, however, that the total number of games (in parentheses on the X axis) only represent the number of games that could result in an upset.
Remember, we define an upset as a seed difference of five or higher between the winning team and losing team. So when we say that 19 percent of games have resulted in an upset in the Round of 64, those 816 games are the number of contests between teams with that seed difference of five or higher.
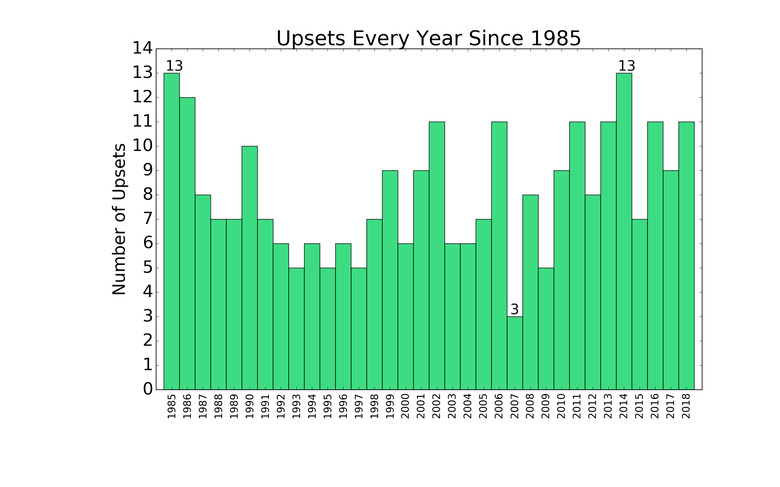
- Mean number of upsets each year: ~8.1
- The Elite Eight has the highest upset percentage among all the rounds with at least 30 possible matchups that could end in an upset.
- Percentiles for the number of upsets per year:
Send Us Your Bracket
Send Us Your Bracket
Want to see how our data plays out? Meet the three sports bloggers who are implementing these stats into their March Madness brackets.
If you end up using our data in your bracket, let us know! Tag us on Twitter @realsciencing or shoot us an email at hello@sciencing.com.
Cite This Article
MLA
Lauing, Jacob. "March Madness Predictions: Statistics To Help You Fill Out A Winning Bracket" sciencing.com, https://www.sciencing.com/march-madness-bracket-predictions-tips-and-tricks-13717661/. 19 March 2019.
APA
Lauing, Jacob. (2019, March 19). March Madness Predictions: Statistics To Help You Fill Out A Winning Bracket. sciencing.com. Retrieved from https://www.sciencing.com/march-madness-bracket-predictions-tips-and-tricks-13717661/
Chicago
Lauing, Jacob. March Madness Predictions: Statistics To Help You Fill Out A Winning Bracket last modified August 30, 2022. https://www.sciencing.com/march-madness-bracket-predictions-tips-and-tricks-13717661/
