Math Madness: Using Basketball Statistics In Math Questions For Students
If you've been following Sciencing's March Madness coverage, you know that statistics and numbers play a huge role in the NCAA Tournament.
The best part? You don't have to be a sports fanatic to work on some sports-centric math problems.
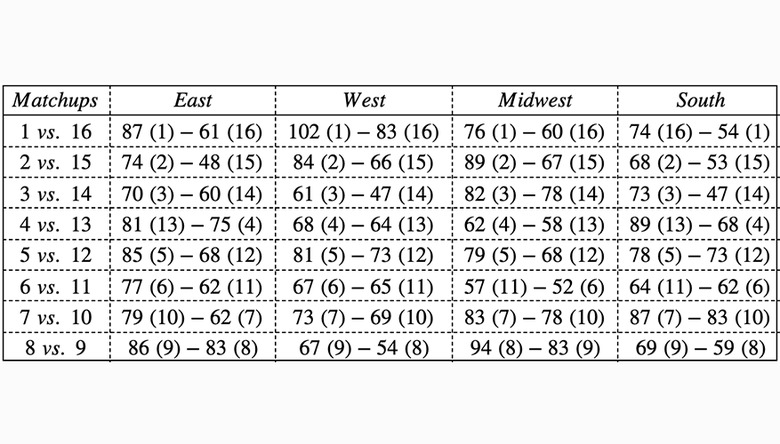
We've created a math worksheet that incorporates data from last year's results. The table below shows the scoring breakdown of each Round of 64 game in 2018. Use it to answer questions 1-5. When you're done, check out the **answer sheet**.
_Click here if you want a closer look at our team's full dataset._
Good luck!
 Sciencing
Statistics Questions:
Statistics Questions:
_Check out our articles on mean, median, mode and interquartile range if you need to brush up before getting started._
**Question 1:** What is the mean difference of scores in East, West, Midwest and South Region for 2018 March Madness Round of 64?
**Question 2:** What is median difference of scores in East, West, Midwest and South Region for 2018 March Madness Round of 64?
**Question 3:** What is IQR (Interquartile Range) of difference of scores in East, West, Midwest and South Region for 2018 March Madness Round of 64?
**Question 4:** Which matchups were outliers in terms of the difference of scores?
**Question 5:** Which region was more "competitive" in the 2018 March Madness Round of 64? Which metric would you use to answer this question: Mean or Median? Why?
**Competitiveness:** The smaller the difference between winning and losing score, the more "competitive" the game is. For example: If the final scores of two games were 80-70 and 65-60 then according to our definition the latter game was more "competitive."
Probability Questions:
Probability Questions:
_Check out our article on binomial probability if you need a refresher._
**Free Throw:** In basketball, free throws or foul shots are unopposed attempts to score points by shooting from behind the free throw line.
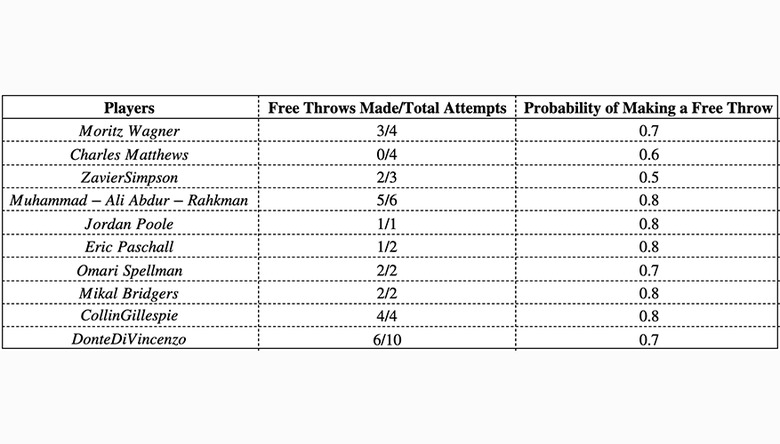
Assuming that each free throw is an independent event then calculating success in free throw shooting can be modeled by Binomial Probability Distribution. Here's the data for free throws made by players in the 2018 National Championship game and their probability of hitting the free throw for the 2017-18 season (note the numbers have been rounded to closest one-place decimal number).
 Sciencing
**Question 1:** Calculate the probability for each player getting the given number of successful free throws in the number of attempts they took.
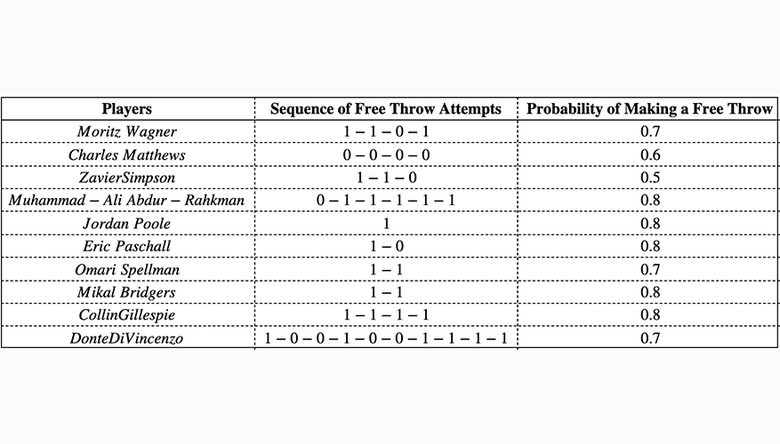
Here's the sequence data for the players' free throw shooting in the same game. 1 means that the free throw was successful and 0 means that it was unsuccessful.
 Sciencing
**Question 2:** Calculate the probability for each player hitting the exact sequence above. Is the probability different from what was calculated before? Why?
Bonus Question
Bonus Question
Using the above probability numbers, answer these questions:
1. Which players had an unlucky/bad day with their free throw shooting? 2. Which players had a lucky/good day with their free throw shooting?
_Feeling the March Madness spirit? Check out our tips and tricks for filling out a bracket, and read why it's so tough to predict upsets and pick a perfect bracket._
Cite This Article
MLA
Contributor, . "Math Madness: Using Basketball Statistics In Math Questions For Students" sciencing.com, https://www.sciencing.com/math-madness-using-basketball-statistics-in-math-questions-for-students-13717683/. 4 March 2019.
APA
Contributor, . (2019, March 4). Math Madness: Using Basketball Statistics In Math Questions For Students. sciencing.com. Retrieved from https://www.sciencing.com/math-madness-using-basketball-statistics-in-math-questions-for-students-13717683/
Chicago
Contributor, . Math Madness: Using Basketball Statistics In Math Questions For Students last modified August 30, 2022. https://www.sciencing.com/math-madness-using-basketball-statistics-in-math-questions-for-students-13717683/